RUSSIAN JOURNAL OF EARTH SCIENCES, VOL. 17, ES5002, doi:10.2205/2017ES000611, 2017
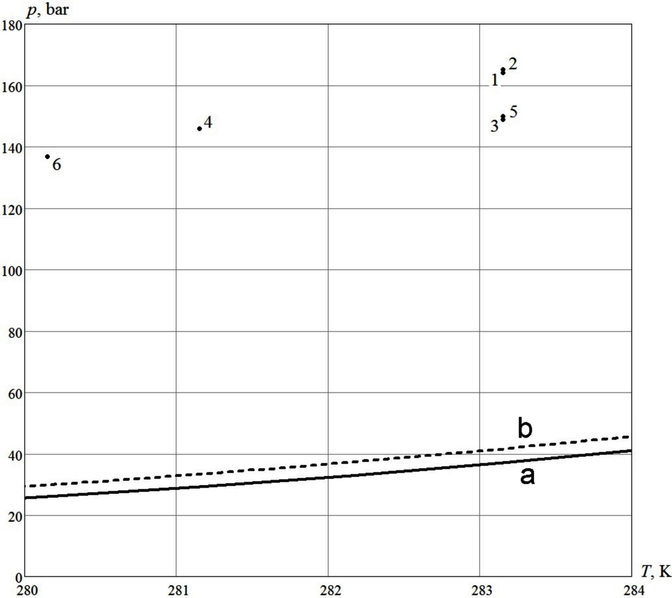
Figure 3. Equilibrium curve of hydrate formation of natural gas: a – calculated for distilled water; b – experimental for "H$_2$O/ARPD" systems. Points correspond to reservoir conditions of oil and gas fields: 1 – the Irelyakhskoe field, 2 – the Machobinskoe field, 3 – the Nelbinskoe field, 4 – the Taas-Yuryzkhskoe field, 5 – the Srednebotuobinskoe field, 6 – the Chayandinskoe field.

![]()
Citation: Ivanova I. K., V. V. Koryakina, M. E. Semenov, I. I. Rozhin (2017), Kinetics of crystallization and melting of hydrate–paraffins and prediction of their formation in oil wells of Nepa-Botuobian anteclise (Eastern Siberia), Russ. J. Earth Sci., 17, ES5002, doi:10.2205/2017ES000611.
Copyright 2017 by the Geophysical Center RAS.
Generated from LaTeX source by ELXpaper, v.1.5 software package.