RUSSIAN JOURNAL OF EARTH SCIENCES, VOL. 17, ES4003, doi:10.2205/2017ES000606, 2017
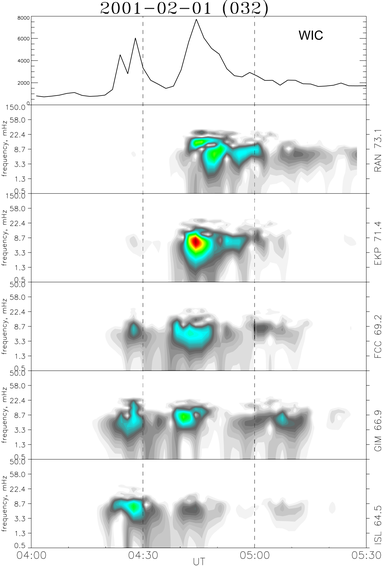
Figure 8. Time evolution of integrated UV auroral intensity (upper panel) and dynamic spectra of geomagnetic fluctuations in the Pi2 band (5–30 mHz) along the latitudinal CARISMA profile $\sim 330\mbox{°}$ on 02/01, 2001 (day 032) 0400–0530 UT.

![]()
Citation: Martines-Bedenko V. A., V. A. Pilipenko, M. J. Engebretson, M. B. Moldwin (2017), Time-spatial correspondence between Pi2 wave power and ultra-violet aurora bursts, Russ. J. Earth Sci., 17, ES4003, doi:10.2205/2017ES000606.
Copyright 2017 by the Geophysical Center RAS.
Generated from LaTeX source by ELXpaper, v.1.5 software package.