RUSSIAN JOURNAL OF EARTH SCIENCES, VOL. 17, ES4002, doi:10.2205/2017ES000605, 2017
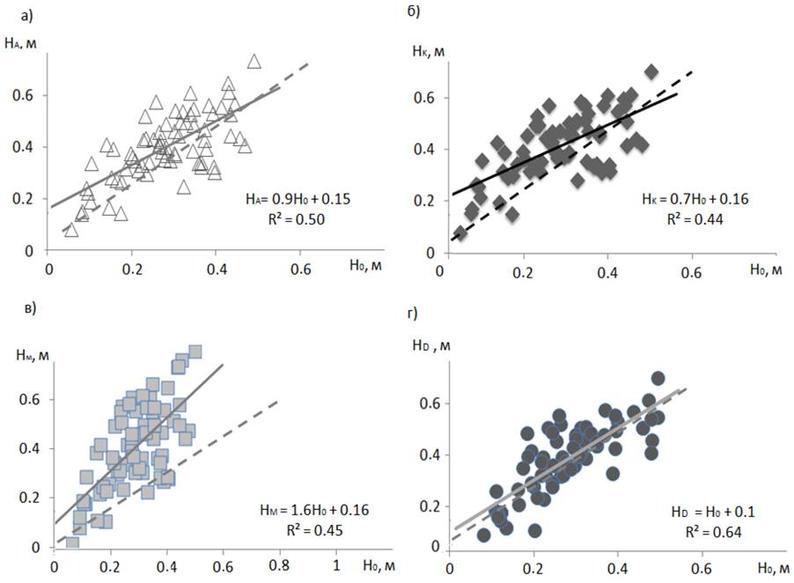
Figure 2. Scatter diagrams of 5-day ablation layer from observations $H_0$ and calculated from the equation of heat balance using different methods of turbulent heat fluxes calculation: a) aerodynamic formulas method $H_A$, b) Kuzmin's method $h_K$, c) Monin-Obukhov method $H_M$, d) direct method $H_D$. Dashed lines show bisectors, solid lines – regression curves. There are also regression equations on the plot.

![]()
Citation: Toropov P. A., A. A. Shestakova, A. M. Smirnov (2017), Methodological aspects of heat balance components estimation on mountain glaciers, Russ. J. Earth Sci., 17, ES4002, doi:10.2205/2017ES000605.
Copyright 2017 by the Geophysical Center RAS.
Generated from LaTeX source by ELXpaper, v.1.5 software package.