RUSSIAN JOURNAL OF EARTH SCIENCES, VOL. 17, ES4001, doi:10.2205/2017ES000604, 2017
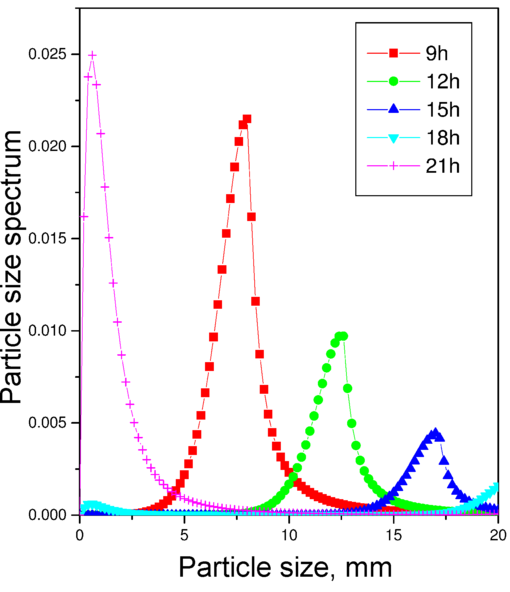
Figure 7. Time evolution of the particle size spectrum. An example of nighttime nucleation and subsequent growth are shown in this picture. The calculations are done with the same parameters as in Figure 8 except for the time dependence of the particle source. The maximal intensity of the source is shifted back by 12h. The source does not work at day time and the particles produced during the nighttime grow in free (no source) regime.

![]()
Citation: Lushnikov A. A., V. A. Zagaynov, Yu. S. Lyubovtseva (2017), Formation of aerosols in the lower troposphere, Russ. J. Earth Sci., 17, ES4001, doi:10.2205/2017ES000604.
Copyright 2017 by the Geophysical Center RAS.
Generated from LaTeX source by ELXpaper, v.1.5 software package.