RUSSIAN JOURNAL OF EARTH SCIENCES, VOL. 17, ES4001, doi:10.2205/2017ES000604, 2017
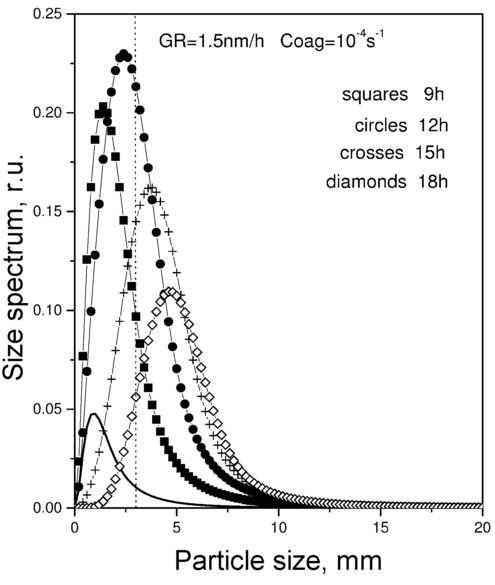
Figure 4. Time evolution of the particle size spectrum. No protoaerosol has presented before the source began to produce fresh particles. Nevertheless, the hump in the spectrum appears in the detectable part of the size spectrum (above 3nm, vertical dotted line). This is also a nucleation burst, but the picture is qualitatively different from that displayed in Figure 3.

![]()
Citation: Lushnikov A. A., V. A. Zagaynov, Yu. S. Lyubovtseva (2017), Formation of aerosols in the lower troposphere, Russ. J. Earth Sci., 17, ES4001, doi:10.2205/2017ES000604.
Copyright 2017 by the Geophysical Center RAS.
Generated from LaTeX source by ELXpaper, v.1.5 software package.