RUSSIAN JOURNAL OF EARTH SCIENCES, VOL. 17, ES3004, doi:10.2205/2017ES000603, 2017
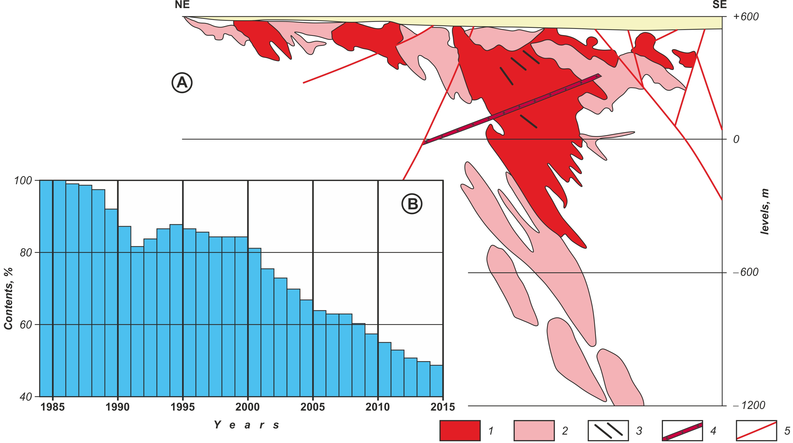
Figure 6. A schematic section and depth of development of the central part of Muruntau deposit (A) and dynamics of gold content change in the process ore in time (B). According to [Sitenkov et al., 2005]. 1 – rich ore columns with ore content $> 0.8$; 2 – low-grade ore bodies with ore content $<0.3$; 3 – gold-bearing quartz veins; 4 – dyke of a plagioporphyry; 5 – faults.

![]()
Citation: Ezhkov Yu. B., R. R. Rakhimov, R. R. Rustamjonov, I. V. Novikova (2017), Ore-geochemical zonality and gold complex potential of Muruntau, Russ. J. Earth Sci., 17, ES3004, doi:10.2205/2017ES000603.
Copyright 2017 by the Geophysical Center RAS.
Generated from LaTeX source by ELXpaper, v.1.5 software package.