RUSSIAN JOURNAL OF EARTH SCIENCES, VOL. 17, ES3003, doi:10.2205/2017ES000602, 2017
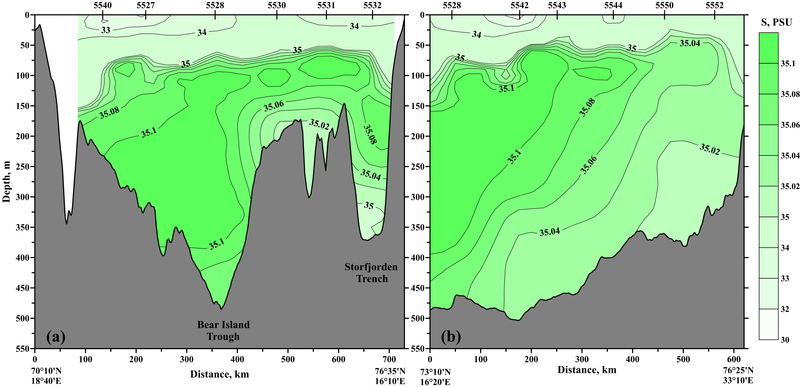
Figure 3. Salinity sections across (a) and along (b) the Bear Island Trough measured on July 23–August 3, 2017. The vertical scale and salinity levels are the same in both figures. The grey color shows the ocean bottom.

![]()
Citation: Frey D. I., A. N. Novigatsky, M. D. Kravchishina, E. G. Morozov (2017), Water structure and currents in the Bear Island Trough in July–August 2017, Russ. J. Earth Sci., 17, ES3003, doi:10.2205/2017ES000602.
Copyright 2017 by the Geophysical Center RAS.
Generated from LaTeX source by ELXpaper, v.1.5 software package.