RUSSIAN JOURNAL OF EARTH SCIENCES, VOL. 17, ES3002, doi:10.2205/2017ES000598, 2017
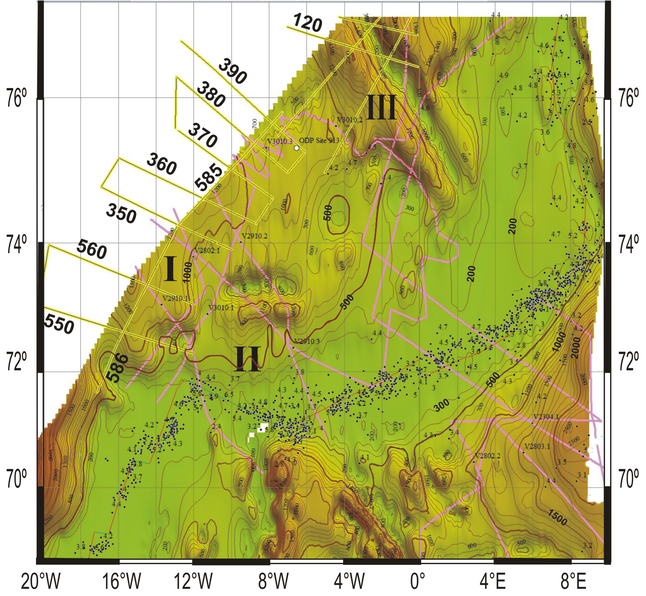
Figure 13. Sediment thickness (https://www.ngdc.noaa.gov/mgg/sedthick/). The isolines are in meters; I–III mark sedimentation depocenters (for explanations see text); the smaller dots with numerals attached mark earthquake epicenters.

![]()
Citation: Usenko S. V., A. N. Boyko, T. V. Prokhorova (2017), Seafloor relief inhomogeneities and the tectonics of the Greenland-Lofoten Basin in the North Atlantic, Russ. J. Earth Sci., 17, ES3002, doi:10.2205/2017ES000598.
Copyright 2017 by the Geophysical Center RAS.
Generated from LaTeX source by ELXpaper, v.1.5 software package.