RUSSIAN JOURNAL OF EARTH SCIENCES, VOL. 17, ES3002, doi:10.2205/2017ES000598, 2017
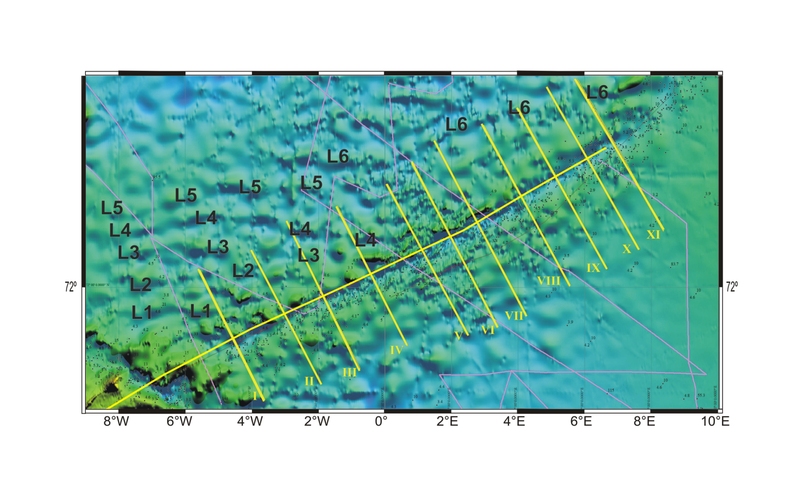
Figure 8. The seafloor relief profiles across the Mohns rift valley (I–XI) (yellow lines). The pink lines mark the Vema seismic cruise. L1 through L6 are morphostructural seafloor inhomogeneities.

![]()
Citation: Usenko S. V., A. N. Boyko, T. V. Prokhorova (2017), Seafloor relief inhomogeneities and the tectonics of the Greenland-Lofoten Basin in the North Atlantic, Russ. J. Earth Sci., 17, ES3002, doi:10.2205/2017ES000598.
Copyright 2017 by the Geophysical Center RAS.
Generated from LaTeX source by ELXpaper, v.1.5 software package.