RUSSIAN JOURNAL OF EARTH SCIENCES, VOL. 17, ES2001, doi:10.2205/2017ES000594, 2017
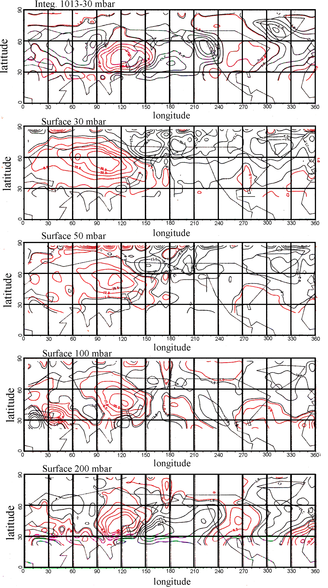
Figure 2. Heat atmospheric zones (red) at different geopotential surfaces.

![]()
Citation: Roshdestvensky A. E., G. A. Malyshev (2017), Large-scale thermal zone of the atmosphere above the oceans and continents, Russ. J. Earth Sci., 17, ES2001, doi:10.2205/2017ES000594.
Copyright 2017 by the Geophysical Center RAS.
Generated from LaTeX source by ELXpaper, v.1.5 software package.