RUSSIAN JOURNAL OF EARTH SCIENCES, VOL. 16, ES6006, doi:10.2205/2016ES000589, 2016
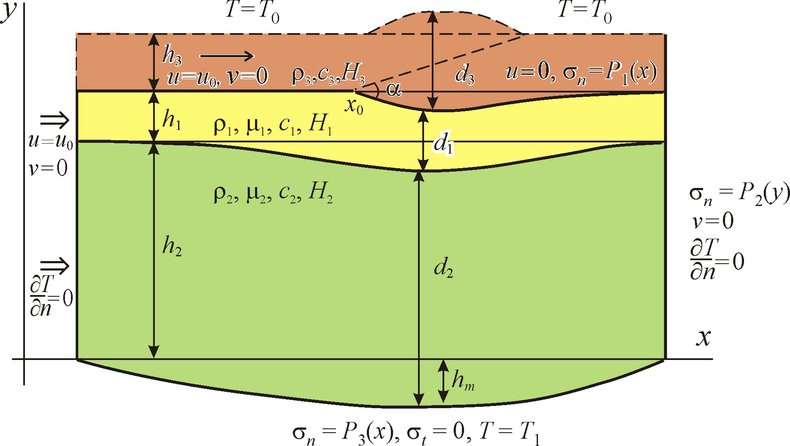
Figure 3. Geometry of the model of deformation and summary of boundary conditions imposed on the model. Indexes $i =1$, 2, 3 correspond to the lower crust (yellow), upper mantle (green) and the upper crust (brown) respectively. The pressure at the upper, right, and lower boundary is denoted as $P_1$, $P_2$, and $P_3$, $\alpha$ – dip angle of the thrust fault.

![]()
Citation: Parphenuk O. I. (2016), Thermal regime and heat transfer during the evolution of continental collision structures, Russ. J. Earth Sci., 16, ES6006, doi:10.2205/2016ES000589.
Copyright 2016 by the Geophysical Center RAS.
Generated from LaTeX source by ELXpaper, v.1.5 software package.