RUSSIAN JOURNAL OF EARTH SCIENCES, VOL. 16, ES6001, doi:10.2205/2016ES000583, 2016
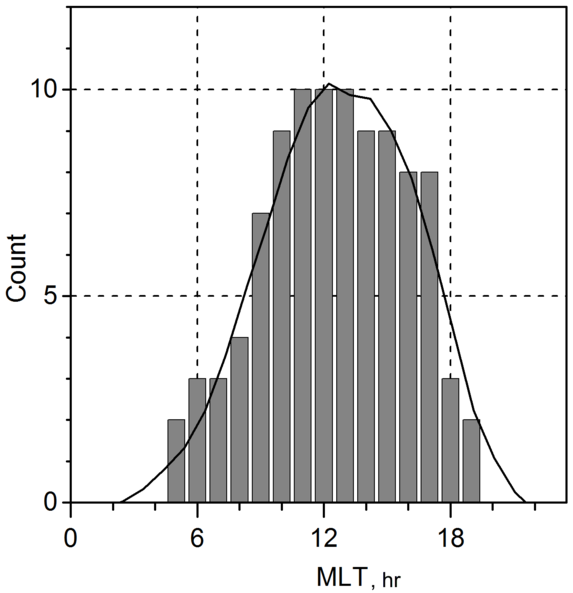
Figure 7. Histogram of the occurrence of negative bays (number of events) in the low-latitude $H$-component in response to SWPd pulse over MLT hours and the smoothed distribution.

![]()
Citation: Lukianova Renata (2016), Unusual geomagnetic response to the solar wind dynamic pressure pulse during storm-time, Russ. J. Earth Sci., 16, ES6001, doi:10.2205/2016ES000583.
Copyright 2016 by the Geophysical Center RAS.
Generated from LaTeX source by ELXpaper, v.1.5 software package.