RUSSIAN JOURNAL OF EARTH SCIENCES, VOL. 16, ES6001, doi:10.2205/2016ES000583, 2016
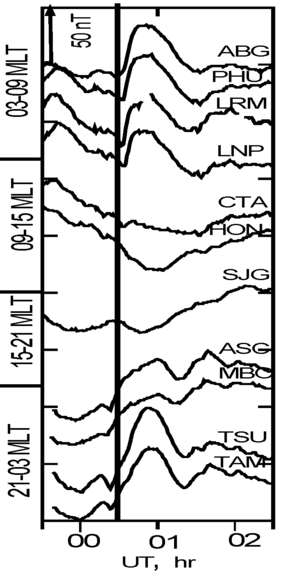
Figure 3. Stack plot of the $H$-component from low-latitude ground magnetometers from 23:30 UT, February 17 till 02:30 UT February 18, 1998. Vertical line indicates the onset of SWPd pulse.

![]()
Citation: Lukianova Renata (2016), Unusual geomagnetic response to the solar wind dynamic pressure pulse during storm-time, Russ. J. Earth Sci., 16, ES6001, doi:10.2205/2016ES000583.
Copyright 2016 by the Geophysical Center RAS.
Generated from LaTeX source by ELXpaper, v.1.5 software package.