RUSSIAN JOURNAL OF EARTH SCIENCES, VOL. 16, ES5003, doi:10.2205/2016ES000580, 2016
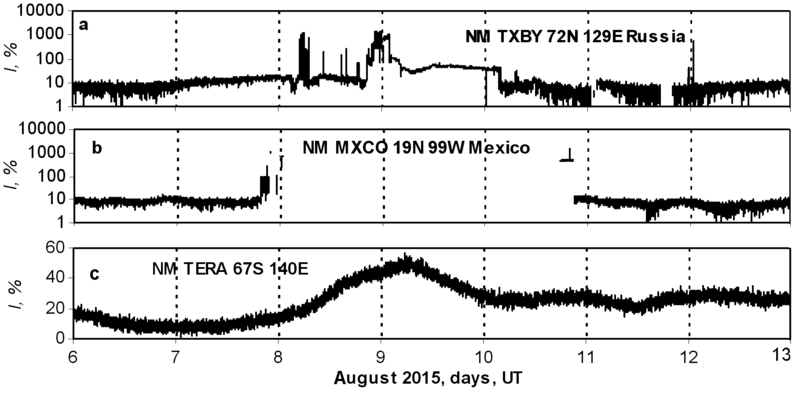
Figure 3. Temporal variations in August 2015: a–c – particle flux intensity, recorded by NM Tixie, NM Mexico, NM Tera, minute data, uncorrected for pressure. NM coordinates are shown at the curves. However, the lack of NM data can't always be explained by the failure of equipment. Perhaps not all NM are able to record large particle fluxes. Their registration systems, at Mexico NM in particular, are not designed for large increases.

![]()
Citation: Shestopalov I. P. (2016), Neutrons of terrestrial origin and the endogenous activity of the Earth, Russ. J. Earth Sci., 16, ES5003, doi:10.2205/2016ES000580.
Copyright 2016 by the Geophysical Center RAS.
Generated from LaTeX source by ELXpaper, v.1.5 software package.