RUSSIAN JOURNAL OF EARTH SCIENCES, VOL. 16, ES4003, doi:10.2205/2016ES000575, 2016
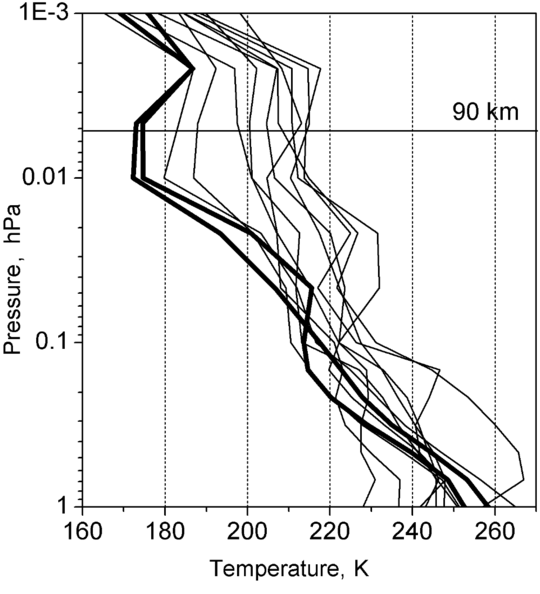
Figure 4. Vertical temperature profiles in January 17–28 as observed with the Aura MLS at the altitudinal range from 1 to 0.001 hPa over SGO. The profiles corresponding to the peaks of the stratospheric warming and mesospheric cooling in January 22–23 are shown by thick lines.

![]()
Citation: Lukianova Renata (2016), Thermal and dynamic perturbations in the winter polar upper atmosphere associated with a major sudden stratospheric warming, Russ. J. Earth Sci., 16, ES4003, doi:10.2205/2016ES000575.
Copyright 2016 by the Geophysical Center RAS.
Generated from LaTeX source by ELXpaper, v.1.5 software package.