RUSSIAN JOURNAL OF EARTH SCIENCES, VOL. 16, ES3005, doi:10.2205/2016ES000569, 2016

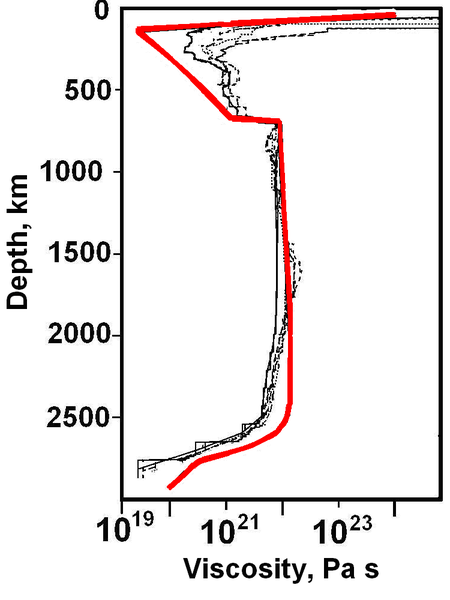
Figure 4. Distribution of viscosity with depth obtained from the data on post-glacial rebound [Paulson et al., 2005], and the viscosity profile calculated from (1)–(6) in the process of convection (red line).
Citation: Trubitsyn V. P., M. N. Evseev (2016), Pulsation of mantle plumes, Russ. J. Earth Sci., 16, ES3005, doi:10.2205/2016ES000569.
Copyright 2016 by the Geophysical Center RAS.
Generated from LaTeX source by ELXpaper, v.1.5 software package.

