RUSSIAN JOURNAL OF EARTH SCIENCES, VOL. 16, ES3001, doi:10.2205/2016ES000568, 2016
Go back to Figure 4
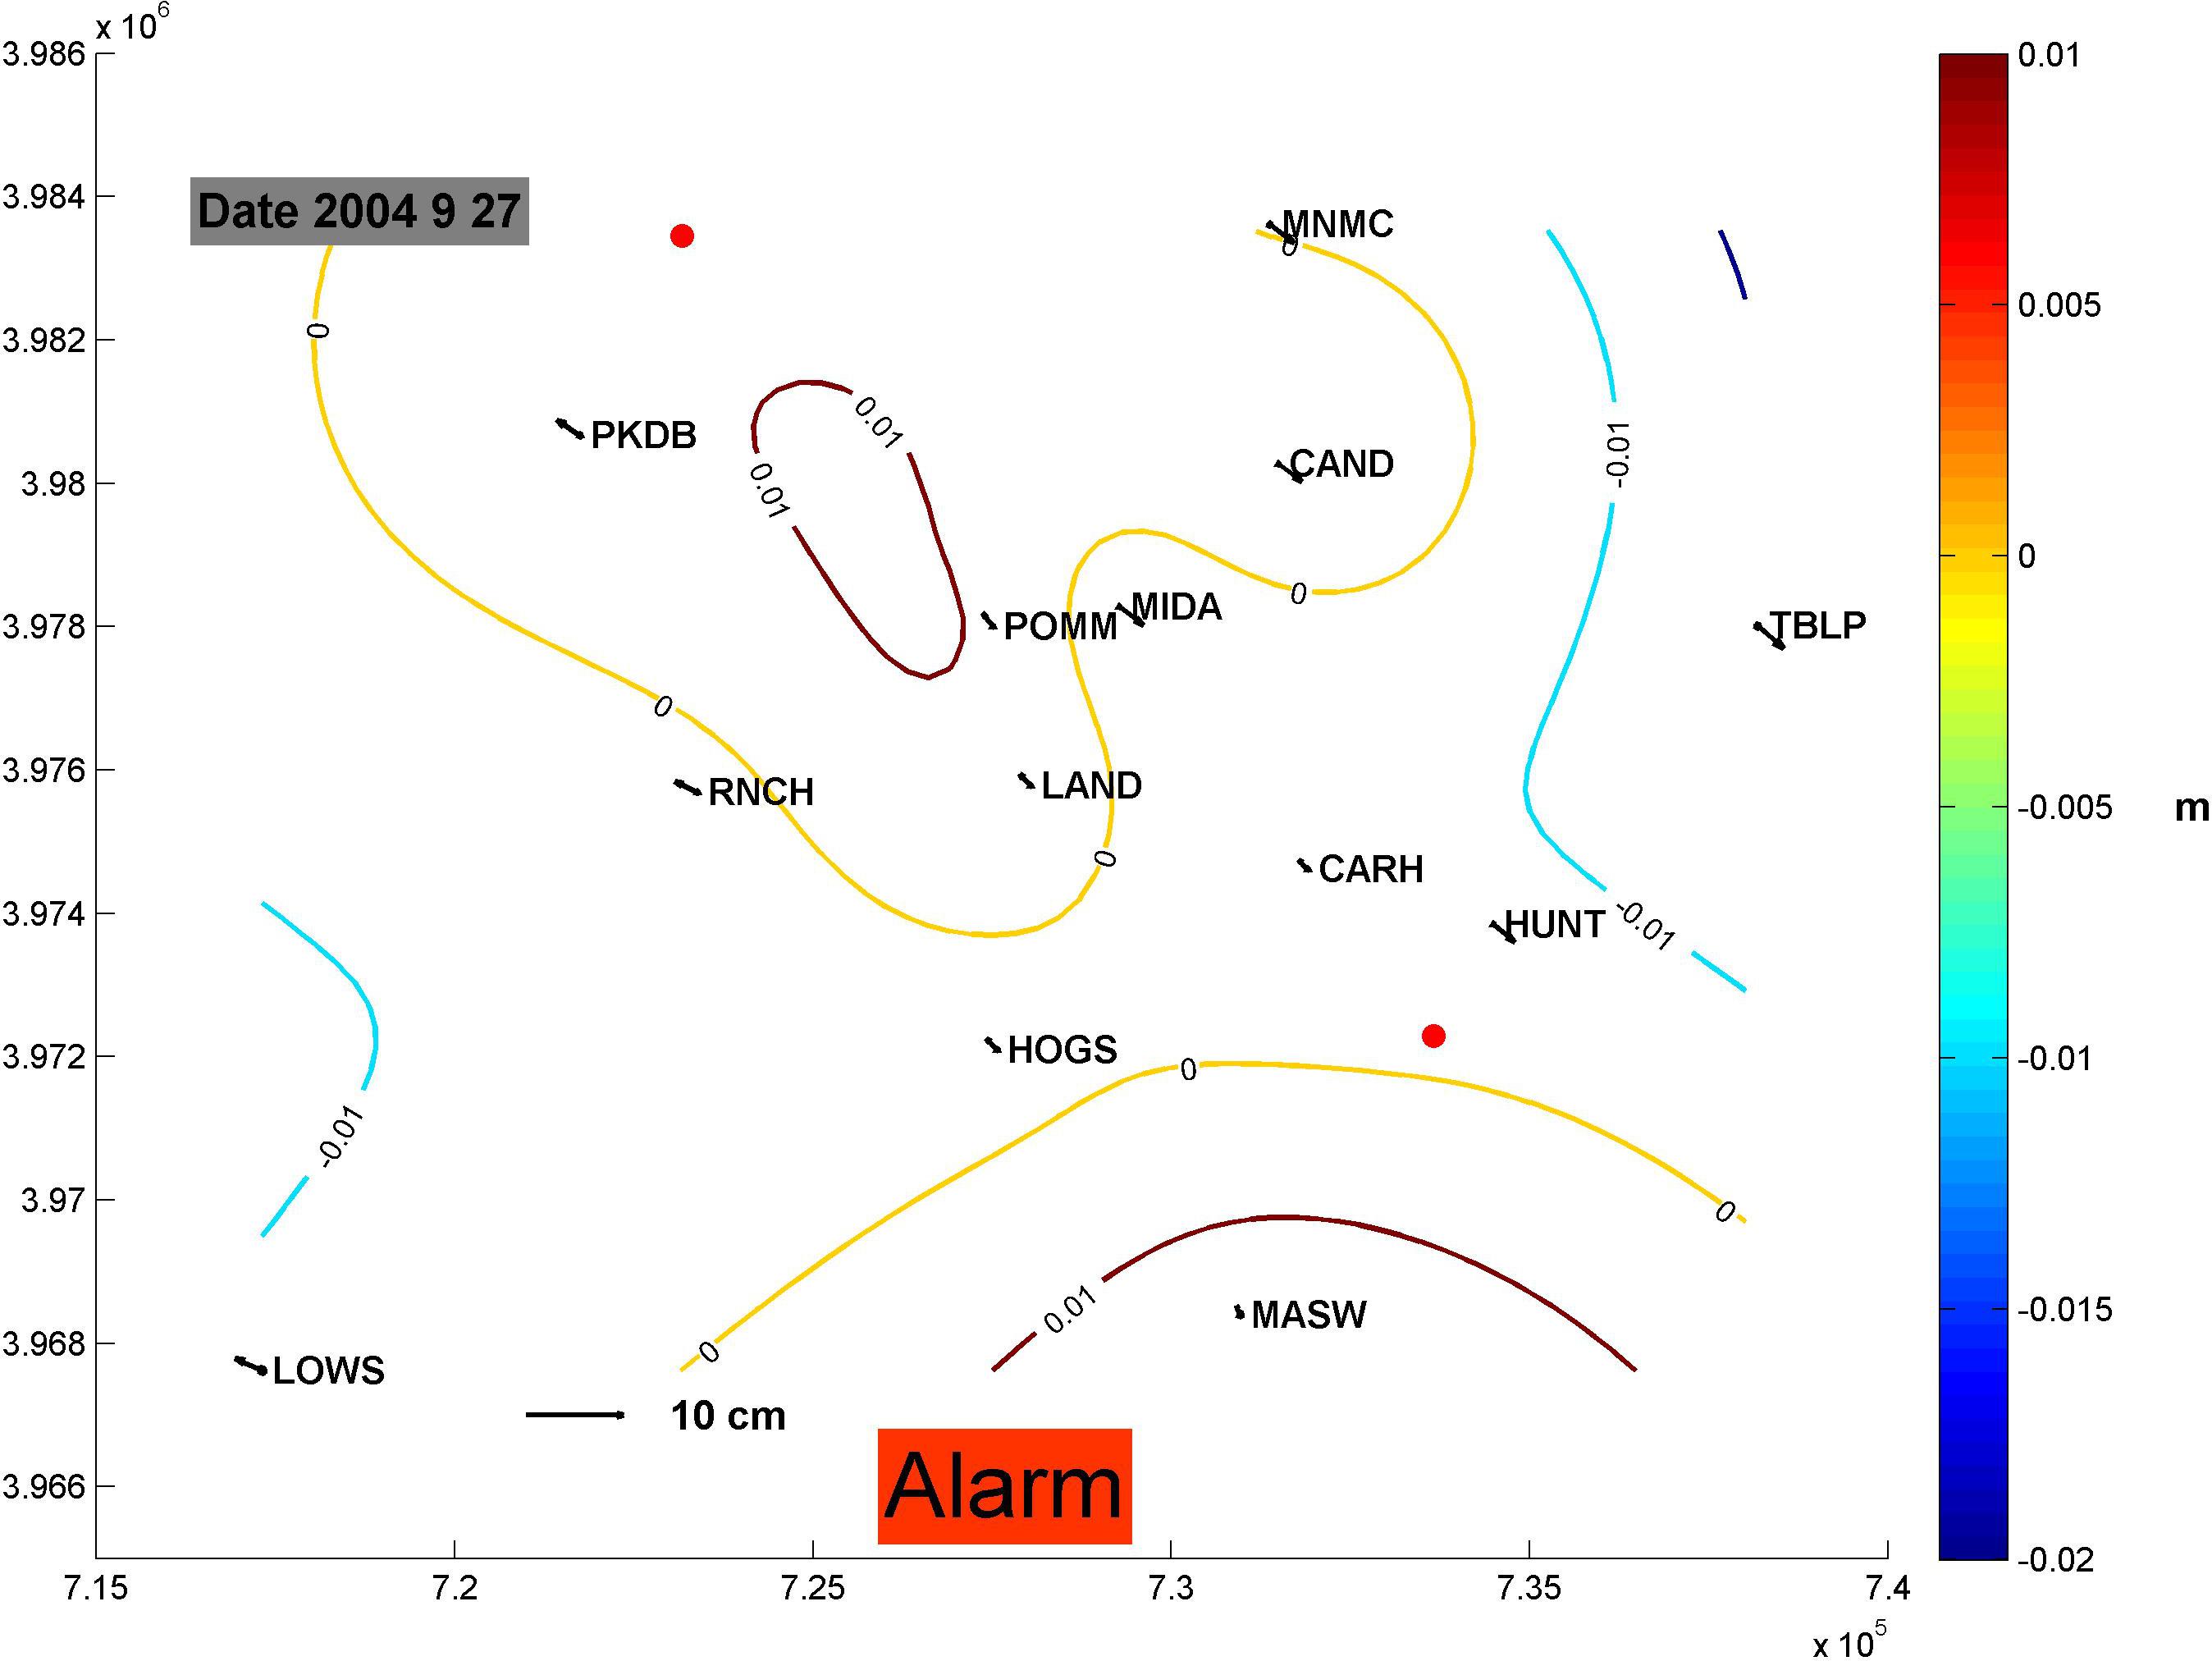
Figure 4e. Preseismic horizontal (arrows) and vertical (contour lines) displacements before the Parkfield earthquake. Solid red dots are strongest foreshocks with M > 4.
Go back to Figure 4