RUSSIAN JOURNAL OF EARTH SCIENCES, VOL. 16, ES2003, doi:10.2205/2016ES000567, 2016
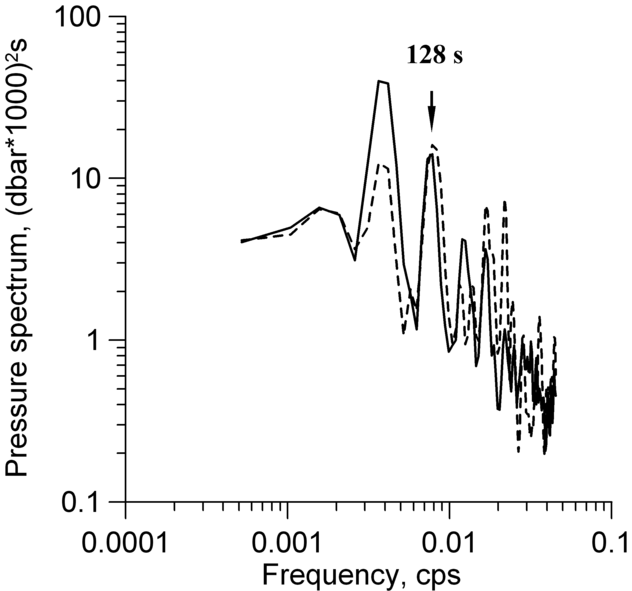
Figure 6. Spectra of bottom pressure fluctuations at points 2 (dashed line) and 4 (solid line). The spectral peaks are related to the transversal mode of seiche oscillations at a frequency of 0.0078125 cps (128 s).

![]()
Citation: Marchenko A. V., E. G. Morozov (2016), Seiche oscillations in Lake Valunden (Spitsbergen), Russ. J. Earth Sci., 16, ES2003, doi:10.2205/2016ES000567.
Copyright 2016 by the Geophysical Center RAS.
Generated from LaTeX source by ELXpaper, v.1.5 software package.