RUSSIAN JOURNAL OF EARTH SCIENCES, VOL. 16, ES2003, doi:10.2205/2016ES000567, 2016
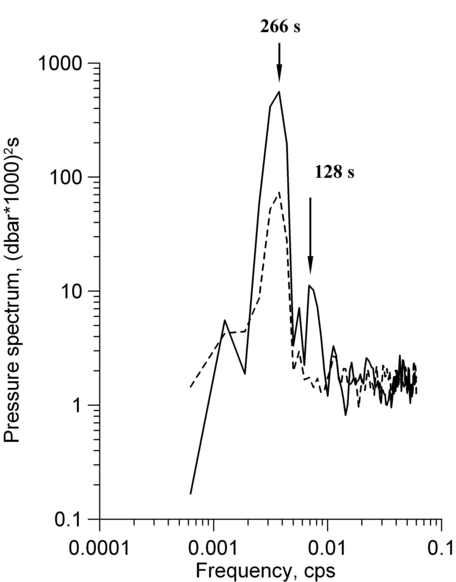
Figure 5. Spectra of bottom pressure fluctuations at points 3 (dashed line) and 5 (solid line). Peaks are at frequency 0.00375 cps (period of longitudinal fluctuations is 266 s). There is no peak in the frequency range 0.0068–0.0078 cps at point 3 because it is located at a node of the transversal mode. There is such a peak at point 5 located in the southeastern part of the lake, which is narrow and shallow.

![]()
Citation: Marchenko A. V., E. G. Morozov (2016), Seiche oscillations in Lake Valunden (Spitsbergen), Russ. J. Earth Sci., 16, ES2003, doi:10.2205/2016ES000567.
Copyright 2016 by the Geophysical Center RAS.
Generated from LaTeX source by ELXpaper, v.1.5 software package.