RUSSIAN JOURNAL OF EARTH SCIENCES, VOL. 16, ES2003, doi:10.2205/2016ES000567, 2016
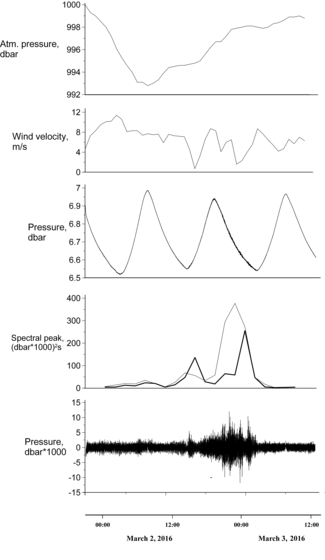
Figure 3. Time variation of different values: (a) atmospheric pressure; (b) wind velocity; (c) bottom pressure; (d) spectral peaks at frequencies of 0.0078125 cps (128 s) (thick line) and 0.0041667 cps (240 s) (thin line); (e) bottom pressure after filtering out the tidal signal.

![]()
Citation: Marchenko A. V., E. G. Morozov (2016), Seiche oscillations in Lake Valunden (Spitsbergen), Russ. J. Earth Sci., 16, ES2003, doi:10.2205/2016ES000567.
Copyright 2016 by the Geophysical Center RAS.
Generated from LaTeX source by ELXpaper, v.1.5 software package.