RUSSIAN JOURNAL OF EARTH SCIENCES, VOL. 16, ES2003, doi:10.2205/2016ES000567, 2016
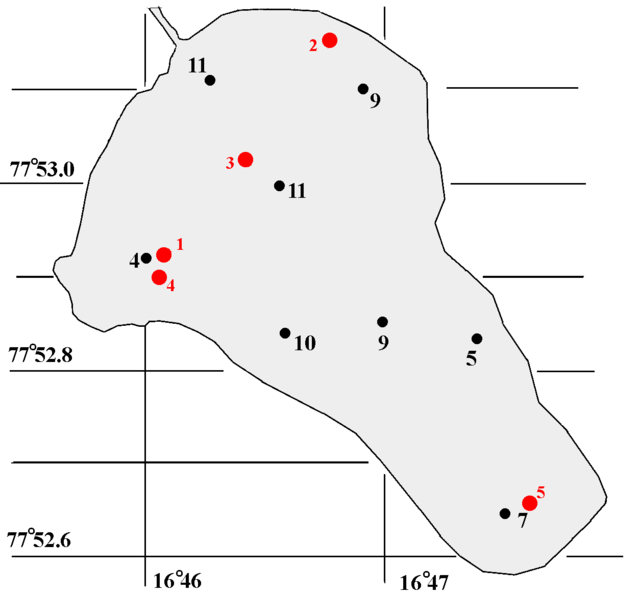
Figure 1. Map of the Lake. Locations of pressure gauges with numbers of stations are shown with large red dots. Small black dots indicate the locations of depth measurements indicated with numerals in meters. The amplitude of tidal variations in depth is 0.5 m.

![]()
Citation: Marchenko A. V., E. G. Morozov (2016), Seiche oscillations in Lake Valunden (Spitsbergen), Russ. J. Earth Sci., 16, ES2003, doi:10.2205/2016ES000567.
Copyright 2016 by the Geophysical Center RAS.
Generated from LaTeX source by ELXpaper, v.1.5 software package.