RUSSIAN JOURNAL OF EARTH SCIENCES, VOL. 16, ES2002, doi:10.2205/2016ES000566, 2016
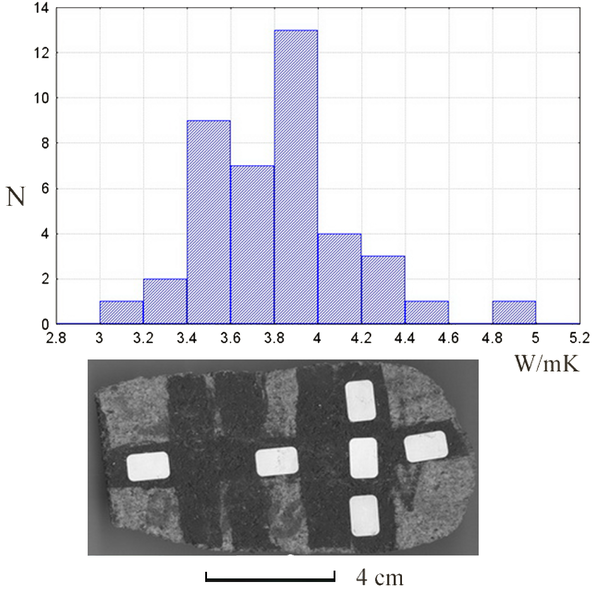
Figure 14. Histogram of thermal conductivity values of the studied xenoliths (up) and directions of the scan lines relative to xenolith shape (below).

![]()
Citation: Grachev A. F. (2016), Anisotropy of elastic properties and thermal conductivity of the upper mantle – a case study of xenoliths shape: Evidence from xenoliths in basalts in North Eurasia, Russ. J. Earth Sci., 16, ES2002, doi:10.2205/2016ES000566.
Copyright 2016 by the Geophysical Center RAS.
Generated from LaTeX source by ELXpaper, v.1.5 software package.