RUSSIAN JOURNAL OF EARTH SCIENCES, VOL. 16, ES2001, doi:10.2205/2016ES000565, 2016
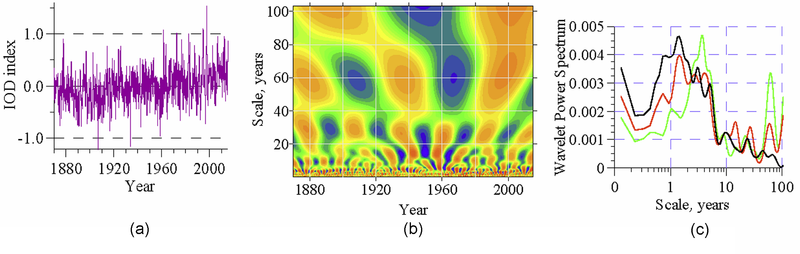
Figure 2. (a) the IOD index, (b) its wavelet transform (WT), (c) its wavelet global spectrum (black curve) and the wavelet global spectra of temperature anomalies which difference produces IOD index – in the west of central part of the Indian Ocean (green) and in the east (red).

![]()
Citation: Zhukov A. N., N. E. Lebedev, A. M. Chukharev (2016), Interdecadal variability of the Arabian Sea and the Indian Ocean, Russ. J. Earth Sci., 16, ES2001, doi:10.2205/2016ES000565.
Copyright 2016 by the Geophysical Center RAS.
Generated from LaTeX source by ELXpaper, v.1.5 software package.