RUSSIAN JOURNAL OF EARTH SCIENCES, VOL. 16, ES2001, doi:10.2205/2016ES000565, 2016
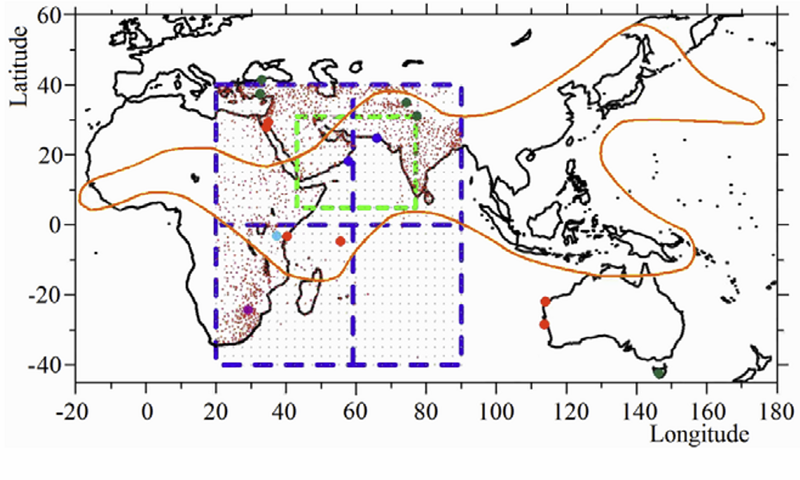
Figure 1. Locations of the NCDC weather stations (red dots), of the grid nodes of the $P$ reanalysis data upon Indian Ocean (gray dots) and of paleoreconstructions stations which data were used: of coral reefs (red circles), bottom sediments (blue), dendrochronology (dark green), ice cores (cyan), stalagmites (purple). The monsoon region in Asia, Africa and Australia is lined by orange contour. The regions under investigation in this paper are contoured by cyan dashed lines. The region under investigation in [Eremeev et al., 2012a] is contoured by green dashed lines.

![]()
Citation: Zhukov A. N., N. E. Lebedev, A. M. Chukharev (2016), Interdecadal variability of the Arabian Sea and the Indian Ocean, Russ. J. Earth Sci., 16, ES2001, doi:10.2205/2016ES000565.
Copyright 2016 by the Geophysical Center RAS.
Generated from LaTeX source by ELXpaper, v.1.5 software package.