RUSSIAN JOURNAL OF EARTH SCIENCES, VOL. 15, ES4002, doi:10.2205/2015ES000556, 2015
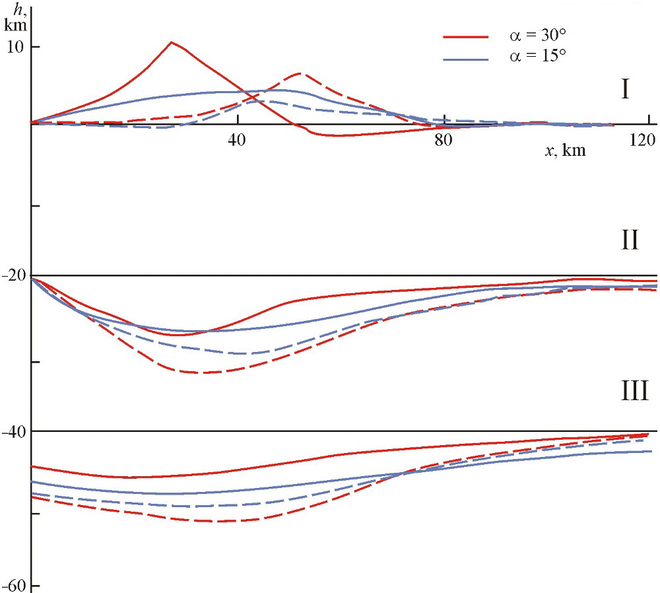
Figure 6. Topography of the free surface (I), upper crust boundary (II) and Moho (III). Solid lines show boundary's positions for $t=3.6$ Ma, broken lines – boundary's positions at the end of thrusting $(t=6.4$ Ma).

![]()
Citation: Parphenuk O. I. (2015), Uplifts formation features in continental collision structures (evolution modeling), Russ. J. Earth Sci., 15, ES4002, doi:10.2205/2015ES000556.
Copyright 2015 by the Geophysical Center RAS.
Generated from LaTeX source by ELXpaper, v.1.4 software package.