RUSSIAN JOURNAL OF EARTH SCIENCES, VOL. 15, ES4002, doi:10.2205/2015ES000556, 2015
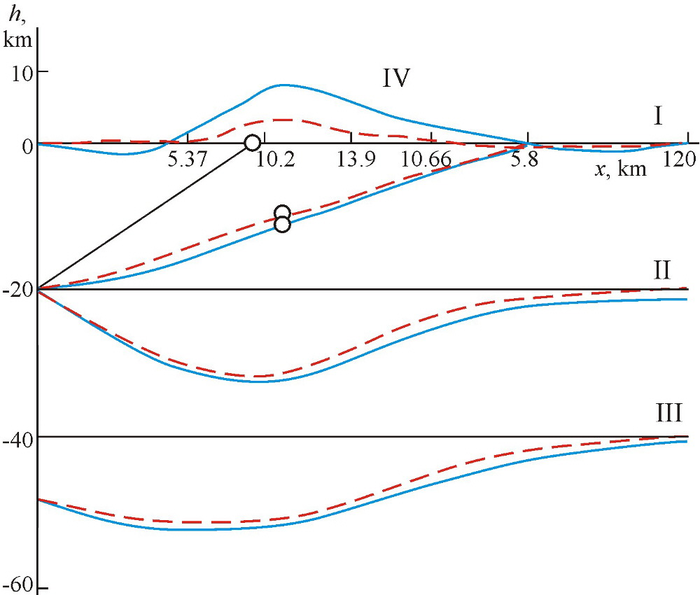
Figure 5. Denudation influence on the boundary's topography in the vicinity of the fault zone. Fault position (I – left of the circle), upper crust (II) and Moho (III), surface relief (IV) without erosion (blue lines) and for the denudation with a rate of 1 mm/yr (red lines) at the end of shortening ($t=7$ Ma). Black solid lines represent the initial boundary's positions. Erosion level (in km) is marked by the numbers under the free surface.

![]()
Citation: Parphenuk O. I. (2015), Uplifts formation features in continental collision structures (evolution modeling), Russ. J. Earth Sci., 15, ES4002, doi:10.2205/2015ES000556.
Copyright 2015 by the Geophysical Center RAS.
Generated from LaTeX source by ELXpaper, v.1.4 software package.