RUSSIAN JOURNAL OF EARTH SCIENCES, VOL. 15, ES4002, doi:10.2205/2015ES000556, 2015
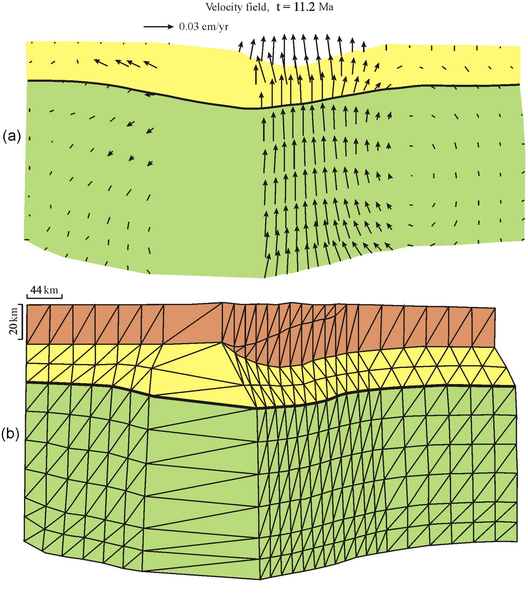
Figure 4. (a) Velocity distribution for flow in the lower crust and upper mantle at post-collision stage (approx. 4 Ma after the end of shortening at a rate of 1 cm/yr) with erosion rate of 1 mm/yr. The heavy line represents Moho boundary. (b) Geometry of the model including the upper crust after the end of upthrusting. Effective viscosity of the lower crust is $10^{22}$ Pa s, and $10^{23}$ Pa s for the lihtospheric upper mantle.

![]()
Citation: Parphenuk O. I. (2015), Uplifts formation features in continental collision structures (evolution modeling), Russ. J. Earth Sci., 15, ES4002, doi:10.2205/2015ES000556.
Copyright 2015 by the Geophysical Center RAS.
Generated from LaTeX source by ELXpaper, v.1.4 software package.