RUSSIAN JOURNAL OF EARTH SCIENCES, VOL. 15, ES4002, doi:10.2205/2015ES000556, 2015
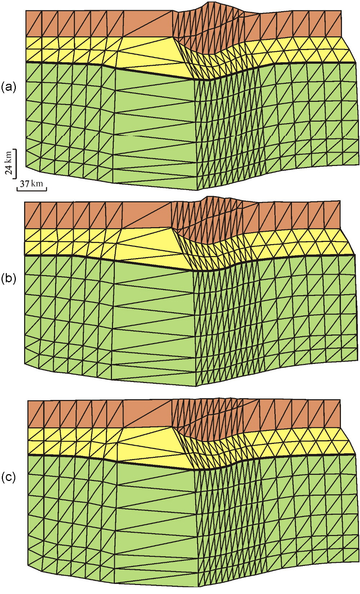
Figure 3. Geometry of deformed area (finite element grid) at the end of shortening event ($t = 7$ Ma) at a rate of 1 cm/yr: (a) without erosion; (b) erosion with a rate of 1 mm/yr starts after $t = 1.82$ Ma; (c) geometry of deformed area 4 Ma after the end of shortening. Black heavy line shows Moho position.

![]()
Citation: Parphenuk O. I. (2015), Uplifts formation features in continental collision structures (evolution modeling), Russ. J. Earth Sci., 15, ES4002, doi:10.2205/2015ES000556.
Copyright 2015 by the Geophysical Center RAS.
Generated from LaTeX source by ELXpaper, v.1.4 software package.