RUSSIAN JOURNAL OF EARTH SCIENCES, VOL. 15, ES3003, doi:10.2205/2015ES000554, 2015
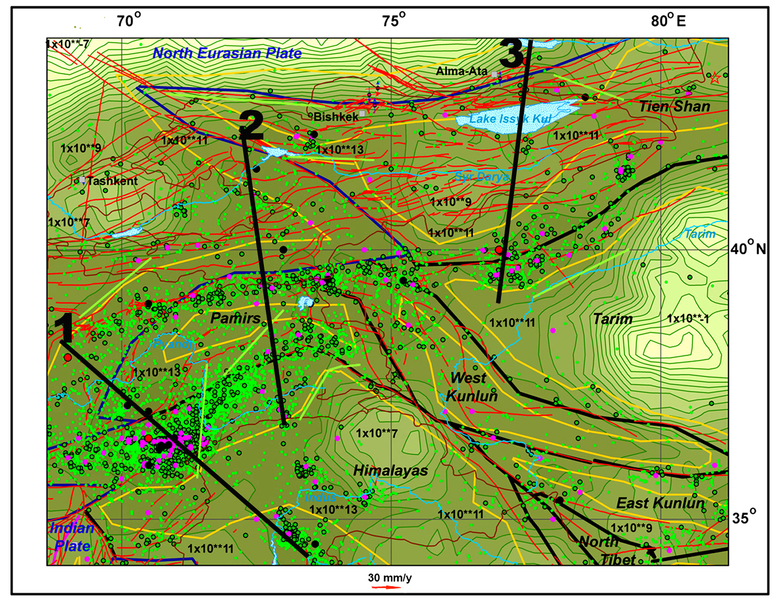
Figure 4. Interblock zones of the region I (the Pamirs, Tien Shan, West Himalayas and adjacent territories). Light green point – epicenter with $M$ 3.99–4.99, light green line – lineament after space images deciphering, which doesn't coincide with active fault. Red arrow – ITRF vertical vector. Some values of energy volume are written. Other captions see in Figure 1 and Figure 3.

![]()
Citation: Gatinsky Yu. G., T. V. Prokhorova (2015), Seismic active zones in South Siberia, Russian Far East, and adjacent countries, Russ. J. Earth Sci., 15, ES3003, doi:10.2205/2015ES000554.
Copyright 2015 by the Geophysical Center RAS.
Generated from LaTeX source by ELXpaper, v.1.3 software package.