RUSSIAN JOURNAL OF EARTH SCIENCES, VOL. 15, ES3002, doi:10.2205/2015ES000553, 2015
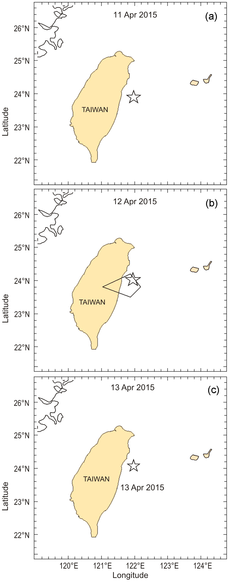
Figure 2. Thermal flux detected in the Taiwan region on 12 April 2015. a – map, corresponding to the date 11 April 2015; b – the same map for the date 12 April 2015; c – the same map for the date 13 April 2015. The asterisk indicates the epicenter of the 20 April 2015, $Mw= 6.6$ Taiwan earthquake. The area limited by the polygon over the asterisk is the area of a large 400 W/m$^2$ heat spot.

![]()
Citation: Wu Hong-Chun, Ivan N. Tikhonov, Ariel R. Césped (2015), Multi-parametric analysis of earthquake precursors, Russ. J. Earth Sci., 15, ES3002, doi:10.2205/2015ES000553.
Copyright 2015 by the Geophysical Center RAS.
Generated from LaTeX source by ELXpaper, v.1.3 software package.