RUSSIAN JOURNAL OF EARTH SCIENCES, VOL. 15, ES2003, doi:10.2205/2015ES000551, 2015
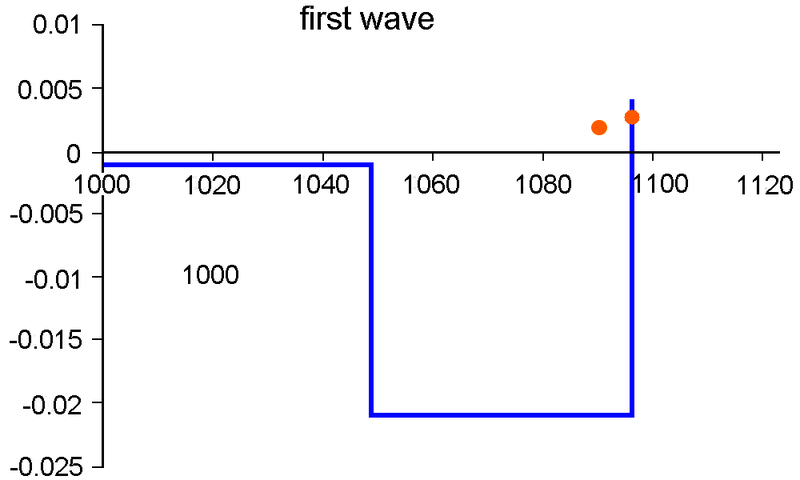
Figure 3. Plot of function $h$ over the period from 1000 to 1096.

![]()
Citation: Tsvetkov V. P., I. V. Tsvetkov (2015), Analysis of a piecewise linear trend of average surface temperature in the mathematical model of multifractal dynamics, Russ. J. Earth Sci., 15, ES2003, doi:10.2205/2015ES000551.
Copyright 2015 by the Geophysical Center RAS.
Generated from LaTeX source by ELXpaper, v.1.3 software package.