RUSSIAN JOURNAL OF EARTH SCIENCES, VOL. 15, ES2001, doi:10.2205/2015ES000548, 2015
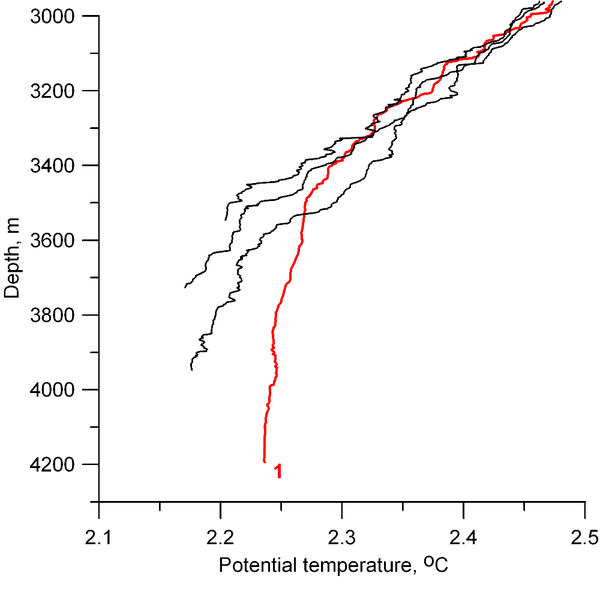
Figure 10. Vertical temperature profiles at stations to the west and east of the ridge (gray lines) and at station 2544 in the rift zone (red) (1). A temperature maximum exists at a distance of 400 m from the bottom. Three "yo-yo" profiles were made through this temperature anomaly. The profile was not stable during half-an-hour of this repeated profiling. This makes us think that the temperature increase over the bottom is caused by the hydrothermal activity.

![]()
Citation: Morozov E. G., A. V. Kolokolova (2015), Physical and chemical properties of seawater over the slopes of the northern part of the Mid-Atlantic Ridge, Russ. J. Earth Sci., 15, ES2001, doi:10.2205/2015ES000548.
Copyright 2015 by the Geophysical Center RAS.
Generated from LaTeX source by ELXpaper, v.1.3 software package.