RUSSIAN JOURNAL OF EARTH SCIENCES, VOL. 15, ES2001, doi:10.2205/2015ES000548, 2015
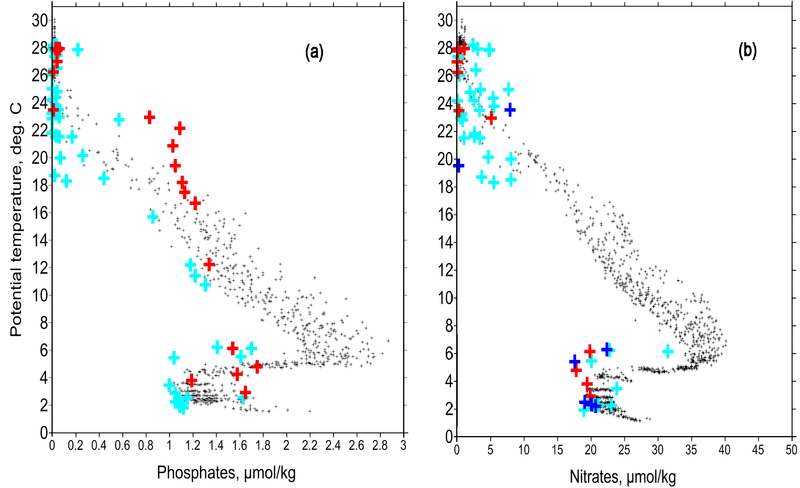
Figure 9. Relation between potential temperature and concentration of phosphates (a); potential temperature and concentration of nitrates (b) over the WOCE A06 section along 7.5° N in 2010 (black dots). Red crosses indicate the easternmost station of the sulfide section in 2014 (station 2546); blue crosses indicate the westernmost station (2542). Light blue crosses indicate all other measurements in 2014.

![]()
Citation: Morozov E. G., A. V. Kolokolova (2015), Physical and chemical properties of seawater over the slopes of the northern part of the Mid-Atlantic Ridge, Russ. J. Earth Sci., 15, ES2001, doi:10.2205/2015ES000548.
Copyright 2015 by the Geophysical Center RAS.
Generated from LaTeX source by ELXpaper, v.1.3 software package.