RUSSIAN JOURNAL OF EARTH SCIENCES, VOL. 15, ES2001, doi:10.2205/2015ES000548, 2015
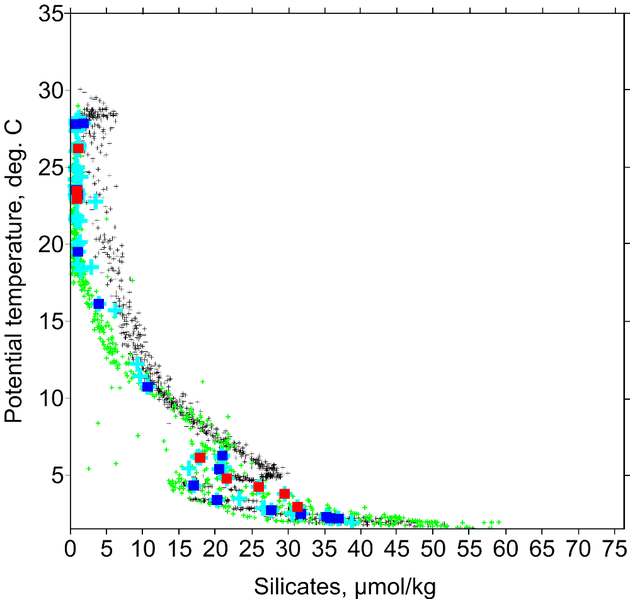
Figure 8. Comparison of the potential temperature–silicates relations over sections: in 2010 (green dots); in 1992 (black dots); in 2014 (red squares east of the MAR and blue squares west of the MAR).

![]()
Citation: Morozov E. G., A. V. Kolokolova (2015), Physical and chemical properties of seawater over the slopes of the northern part of the Mid-Atlantic Ridge, Russ. J. Earth Sci., 15, ES2001, doi:10.2205/2015ES000548.
Copyright 2015 by the Geophysical Center RAS.
Generated from LaTeX source by ELXpaper, v.1.3 software package.