RUSSIAN JOURNAL OF EARTH SCIENCES, VOL. 15, ES2001, doi:10.2205/2015ES000548, 2015
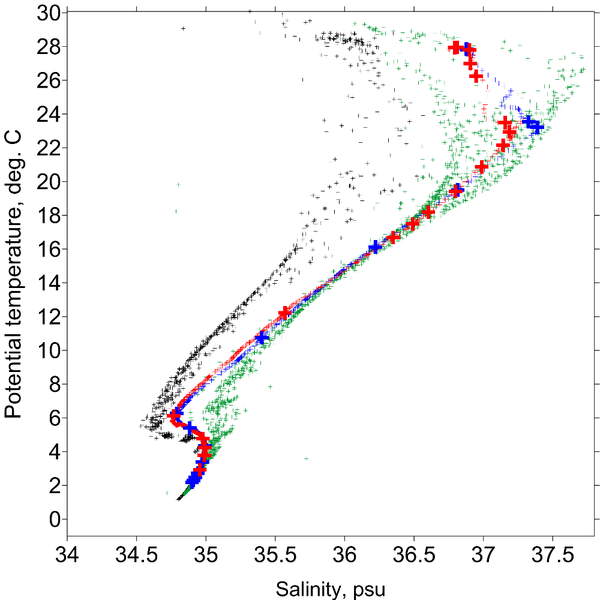
Figure 7. Relation between potential temperature and salinity. Black dots indicate the data from the WOCE A05 section in 1992; the green dots are related to the data of A06 section in 2010. Red dots and crosses correspond to the data of easternmost station 2546 in 2014. Blue dots and crosses indicate the data from the westernmost station 2542 west of the MAR. Large crosses denote the hydrochemical samples.

![]()
Citation: Morozov E. G., A. V. Kolokolova (2015), Physical and chemical properties of seawater over the slopes of the northern part of the Mid-Atlantic Ridge, Russ. J. Earth Sci., 15, ES2001, doi:10.2205/2015ES000548.
Copyright 2015 by the Geophysical Center RAS.
Generated from LaTeX source by ELXpaper, v.1.3 software package.