RUSSIAN JOURNAL OF EARTH SCIENCES, VOL. 15, ES2001, doi:10.2205/2015ES000548, 2015
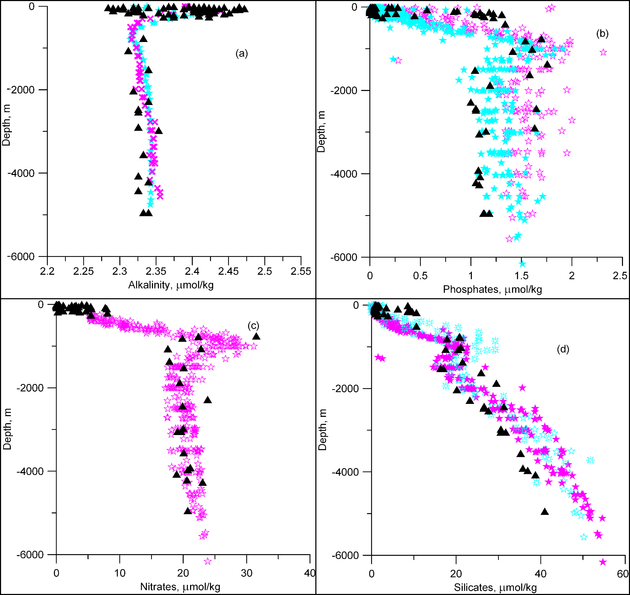
Figure 5. Vertical profiles of chemical parameters based on the historical stations and data in 2014: a – alkalinity, b – phosphates, c – nitrates, and d – silicates. The differences between the measurements east and west of the ridge are most clearly seen on the phosphate concentration. Light green stars show the measurements west of the ridge; pink color shows the measurements east of the ridge. Our data are shown with black triangles.

![]()
Citation: Morozov E. G., A. V. Kolokolova (2015), Physical and chemical properties of seawater over the slopes of the northern part of the Mid-Atlantic Ridge, Russ. J. Earth Sci., 15, ES2001, doi:10.2205/2015ES000548.
Copyright 2015 by the Geophysical Center RAS.
Generated from LaTeX source by ELXpaper, v.1.3 software package.