RUSSIAN JOURNAL OF EARTH SCIENCES, VOL. 14, ES2005, doi:10.2205/2014ES000542, 2014
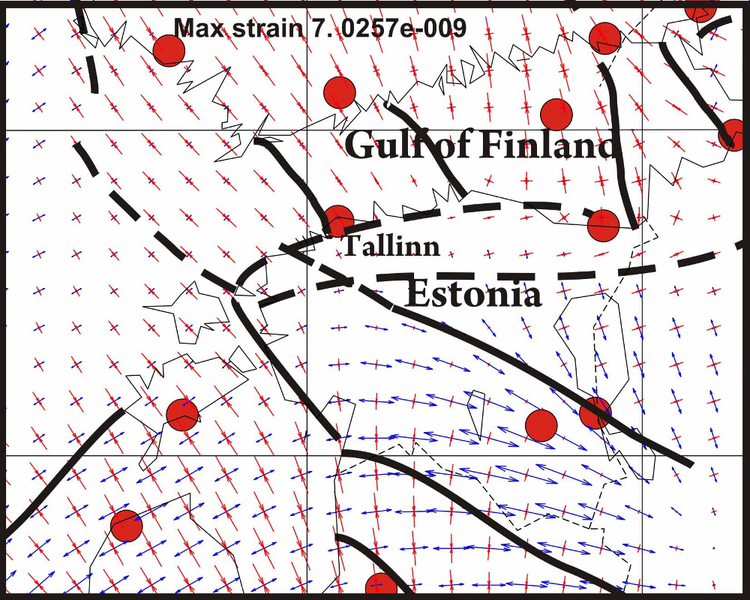
Figure 6. Horizontal deformation based on GPS observations from [Gorshkov et al., 2013]. Blue and red arrows show vectors of tension and compression, respectively. Red circles are station GPS. Black solid and dotted lines are active lineaments revealed reliably or unreliable respectively.

![]()
Citation: Assinovskaya B. A., M. K. Ovsov (2014), Seismotectonic zoning of the Finnish–Bothnia region based on the structural analysis method, Russ. J. Earth Sci., 14, ES2005, doi:10.2205/2014ES000542.
Copyright 2014 by the Geophysical Center RAS.
Generated from LaTeX source by SemTeXML, v.1.2 software package.