RUSSIAN JOURNAL OF EARTH SCIENCES, VOL. 14, ES2005, doi:10.2205/2014ES000542, 2014
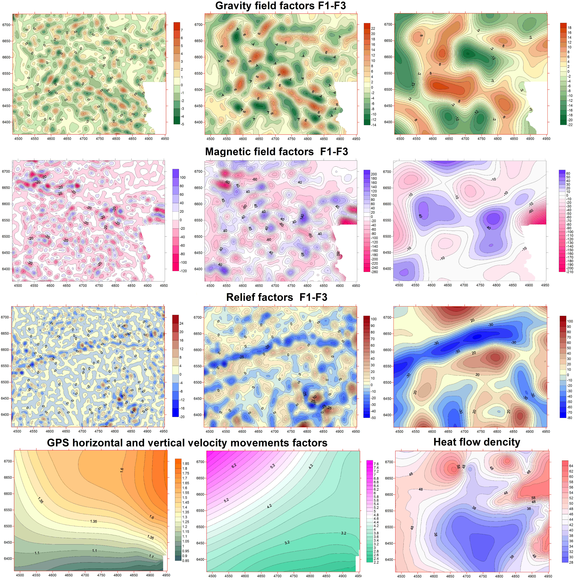
Figure 3. First stage of research. The local, intermediate and regional components (left to right) of the Bouguer anomaly gravity maps, magnetic anomaly maps (both in conventional units) and topography (m) are shown on the top three rows respectively. Geodynamical (mm/year) and geothermal (mW/m$^2$) data (bottom rows) are not separated on the components because of a small amount of data.

![]()
Citation: Assinovskaya B. A., M. K. Ovsov (2014), Seismotectonic zoning of the Finnish–Bothnia region based on the structural analysis method, Russ. J. Earth Sci., 14, ES2005, doi:10.2205/2014ES000542.
Copyright 2014 by the Geophysical Center RAS.
Generated from LaTeX source by SemTeXML, v.1.2 software package.