RUSSIAN JOURNAL OF EARTH SCIENCES, VOL. 14, ES2002, doi:10.2205/2014ES000540, 2014
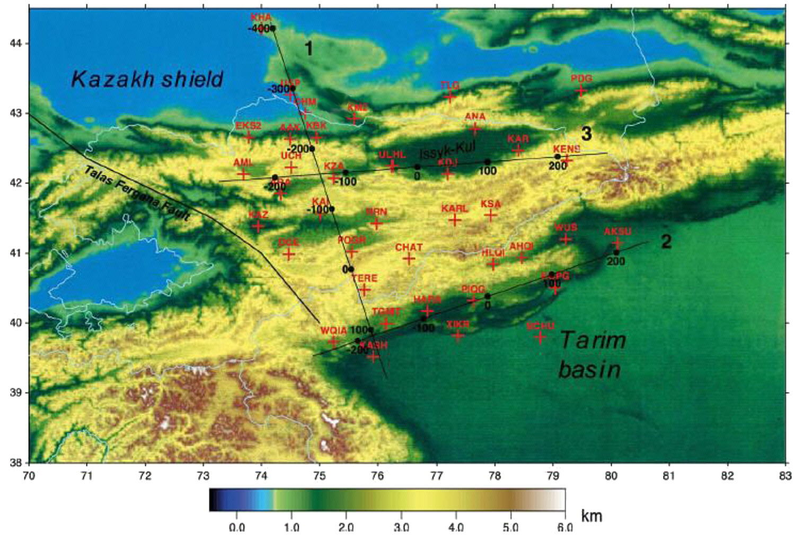
Figure 8. Map of the North Tien Shan with seismograph stations (red crosses). Straight lines are the profiles of the $S$ velocity sections [Vinnik et al., 2004].

![]()
Citation: Grachev A. F., P. V. Ermolov, Yifen Wang (2014), Modification of the lithospheric mantle during the early activity of a cenozoic plume in the North Tien Shan: Evidence from mantle xenoliths in basalts, Russ. J. Earth Sci., 14, ES2002, doi:10.2205/2014ES000540.
Copyright 2014 by the Geophysical Center RAS.
Generated from LaTeX source by SemTeXML, v.1.2 software package.