RUSSIAN JOURNAL OF EARTH SCIENCES, VOL. 14, ES2002, doi:10.2205/2014ES000540, 2014
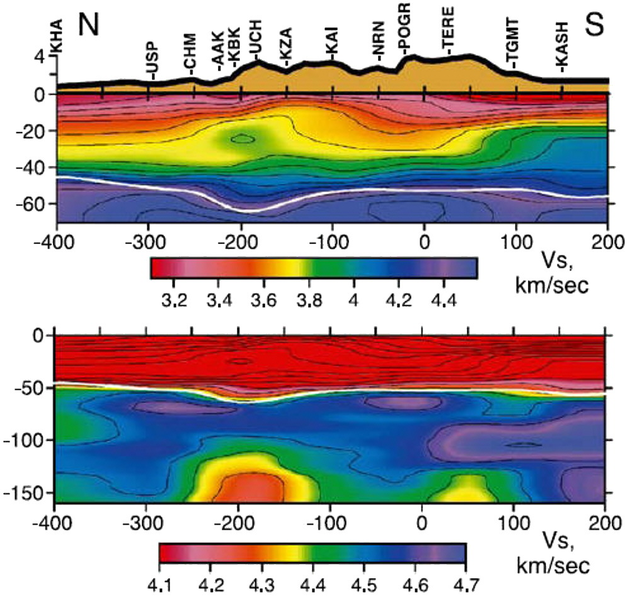
Figure 7. Cross-section of the $S$ velocity model along the line in Figure 1 for the crust (top) and for the crust and mantle (bottom) [Vinnik et al., 2004]. Topography along the line is shown at the top. The stations are from the corridor $\pm 50$ km wide.

![]()
Citation: Grachev A. F., P. V. Ermolov, Yifen Wang (2014), Modification of the lithospheric mantle during the early activity of a cenozoic plume in the North Tien Shan: Evidence from mantle xenoliths in basalts, Russ. J. Earth Sci., 14, ES2002, doi:10.2205/2014ES000540.
Copyright 2014 by the Geophysical Center RAS.
Generated from LaTeX source by SemTeXML, v.1.2 software package.