RUSSIAN JOURNAL OF EARTH SCIENCES, VOL. 12, ES5002, doi:10.2205/2012ES000521, 2012
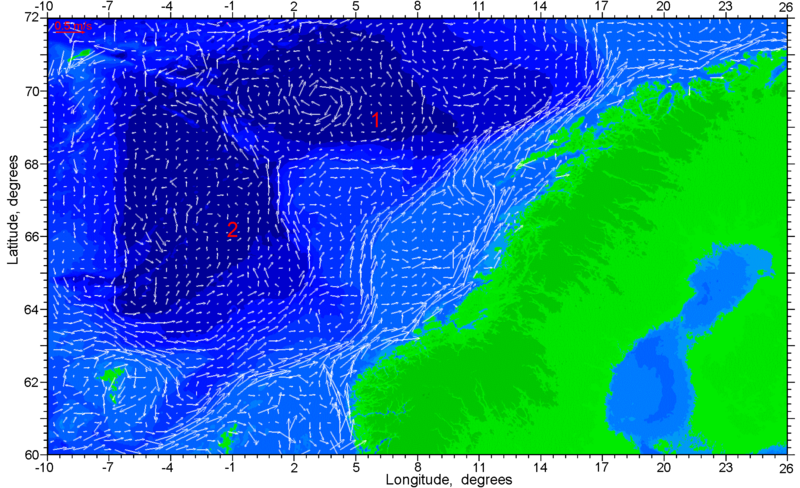
Figure 6. Velocity vectors of average surface currents in the Norwegian basin. The map is constructed with the help of drifter data, averaged over the observation period from 1991 to 2011 and over the grid cells with steps 0.25° along latitude and 0.5° along longitude. The scale vector of velocity is shown on the map top. Isobaths correspond to depths 20, 100, 500, 1000, 1500, 2000, 2500, 3000, 4000 and 6000 m, isohypses – to heights 100, 500 and 2000 m. Lofoten and Norwegian hollows are indicated by 1 and 2 (in red color).
![]()
![]()
Citation: Nikitin O. P. (2012), Storage, processing and visualization data system of drifter observations of surface currents in the World Ocean, Russ. J. Earth Sci., 12, ES5002, doi:10.2205/2012ES000521.
Copyright 2012 by the Geophysical Center RAS.
Generated from LaTeX source by SemTeXML, v.1.2) software package.