RUSSIAN JOURNAL OF EARTH SCIENCES, VOL. 12, ES5002, doi:10.2205/2012ES000521, 2012
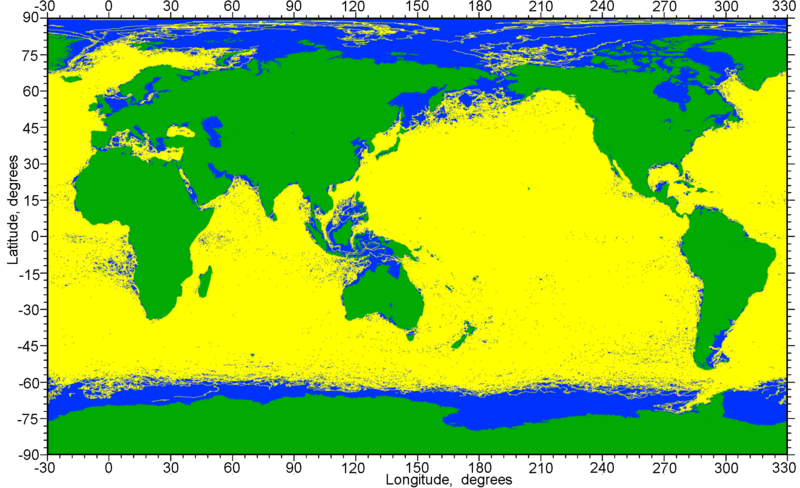
Figure 2. Coverage of the World Ocean by drifter observations. The map is constructed by trajectories (are represented in yellow color) of drifting buoys from 15.02.1979 till 31.12.2011.
![]()
![]()
Citation: Nikitin O. P. (2012), Storage, processing and visualization data system of drifter observations of surface currents in the World Ocean, Russ. J. Earth Sci., 12, ES5002, doi:10.2205/2012ES000521.
Copyright 2012 by the Geophysical Center RAS.
Generated from LaTeX source by SemTeXML, v.1.2) software package.