RUSSIAN JOURNAL OF EARTH SCIENCES, VOL. 12, ES4002, doi:10.2205/2012ES000517, 2012
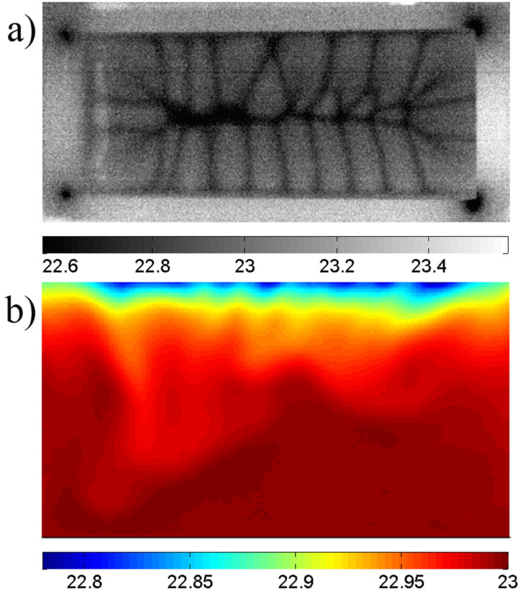
Figure 8. Temperature fields (° C) for evaporating ethanol. a) Surface temperature field observed by thermal imaging, b) side view of temperature distribution obtained by BOS. Images are taken 19 s after taking off the lid.
![]()
![]()
Citation: Plaksina Yu. Yu., A. V. Uvarov, N. A. Vinnichenko, V. B. Lapshin (2012), Experimental investigation of near-surface small-scale structures at water–air interface: Background Oriented Schlieren and thermal imaging of water surface, Russ. J. Earth Sci., 12, ES4002, doi:10.2205/2012ES000517.
Copyright 2012 by the Geophysical Center RAS.
Generated from LaTeX source by SemTeXML, v.1.2) software package.