RUSSIAN JOURNAL OF EARTH SCIENCES, VOL. 12, ES4001, doi:10.2205/2012ES000516, 2012
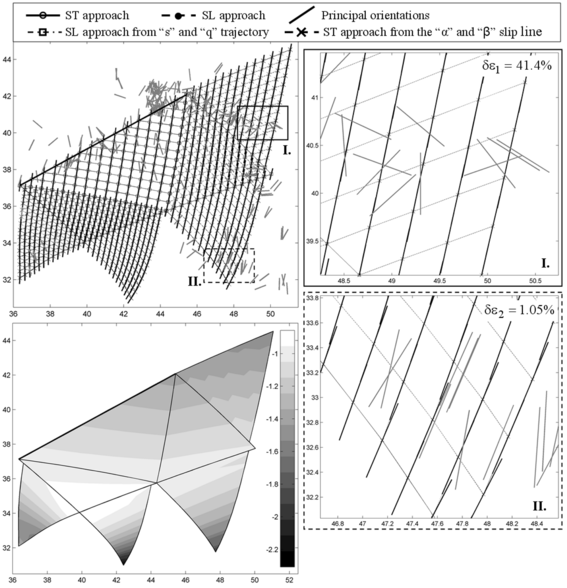
Figure 11. The grids of slip lines and stress trajectories and the map of normalized mean stress for the region in Eastern Anatolia and Arabic plate (left). Visual and numerical comparison of the reconstructed and observed orientations $\theta$ in two areas (right). Detail I. identifies a relative error of $\delta \varepsilon_1= 41.4\%$ and in detail II. it is $\delta \varepsilon_2= 1.05\%$.
![]()
![]()
Citation: Haderka P., A. N. Galybin (2012), Plastic stress field reconstruction based on stress orientations data, Russ. J. Earth Sci., 12, ES4001, doi:10.2205/2012ES000516.
Copyright 2012 by the Geophysical Center RAS.
Generated from LaTeX source by SemTeXML, v.1.2) software package.