RUSSIAN JOURNAL OF EARTH SCIENCES, VOL. 12, ES4001, doi:10.2205/2012ES000516, 2012
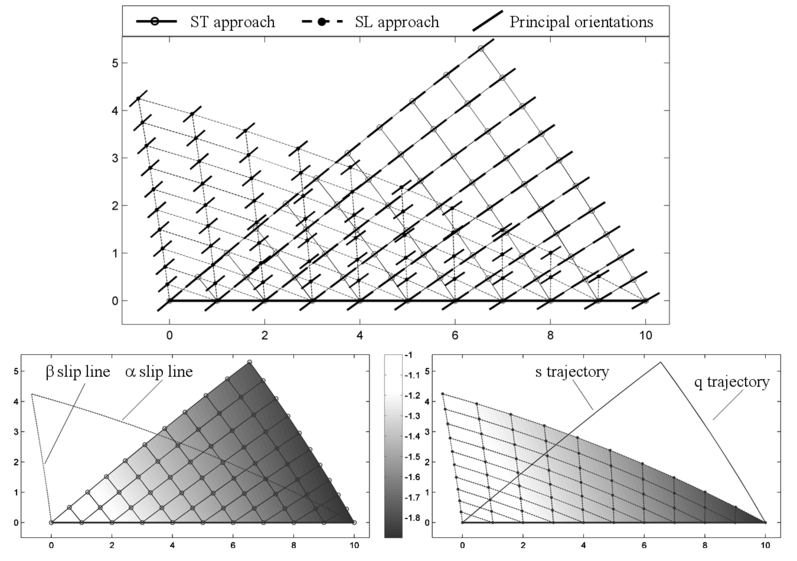
Figure 2. The grids of stress trajectories and slip lines and the comparison of the principal stress orientations obtained by the different methods (top), and fields of mean stress (bottom) for $a = -1$, $b = 40$, $c = -0.02$, $d = 0.72$.
![]()
![]()
Citation: Haderka P., A. N. Galybin (2012), Plastic stress field reconstruction based on stress orientations data, Russ. J. Earth Sci., 12, ES4001, doi:10.2205/2012ES000516.
Copyright 2012 by the Geophysical Center RAS.
Generated from LaTeX source by SemTeXML, v.1.2) software package.