[20] We introduce a parameter
 | (19) |
 1 and
C(x)=(gH(x))1/2 is a slowly varying function.
[21] The problem now is to find asymptotic solutions h(x,t) to the wave equation with variable coefficient. They can be expressed by means of the wavefront formed by rays (an accurate definition is given in the next subsection). One has to introduce curved rays and characteristics given by 1-D family of trajectories P(t,y),X(t,y) of an appropriate Hamiltonian system. This Hamiltonian system can be found using a WKB expression for h= A(x,t) exp(iS(x,t)/h) (with some small artificial parameter h ) inserting it in the equation and considering the equations of zero and first orders. The first order equation is the Hamilton-Jacobi equation similar to (15) but with coefficient C(x) instead of C0.
[22] The solutions of the corresponding Hamiltonian system define
trajectories which are not straight lines as in the case with
the constant coefficient
C0, but are curves. We mentioned
before that WKB solutions do not describe the localized
solutions. In order to pass from oscillating solutions to
localized ones we introduce a new variable
r, put
h=l/r, multiply WKB solutions by some decaying (as
r
 ) function
g(r, y) and integrate this
product over
r from
0 to
 . We obtain a function
localized in the neighborhood of the points
S=0 which
determine the front. The variable
r and the angle
y are similar to that ones appeared in the case of the basin with
an uniform depth. The problem is to define the phase
S(x,t) and the function
g(r, y) in such a way to obtain the
solution of (1, 2). The difficulty is that for
t=0 the phase
S corresponding to (1, 2)
is not a smooth function, and the point
x=0 is a (strong)
focal point. Thus it is necessary to use the asymptotic
representation different from WKB-solutions and we use the
Maslov canonical operator [Maslov, 1965; Maslov and Fedoiuk, 1981;
Dobrokhotov and Zhevandrov, 2003]. The realization of these ideas
together with boundary layer expansions
[Maslov, 1973; Vishik qnd Lusternik, 1962] near the wave fronts
gives not only the phase
S and function
g(r, y)=(r)1/2
 (r,y) (
 is
the same as in (5)), but also global asymptotic
solutions to problem (1, 2) which satisfies
the initial conditions at
t=0 and is correct in the cases with
focal and self intersection points on the front etc (see
[Dobrokhotov et al., 2006b]). Let us note that to construct the solutions with
localized initial data one can try to use the asymptotics of
the Green function (see e.g. [Brekhovskikh and Godin, 2006; Kiselev, 2006]),
but during the realization of this approach one has to calculate
quite complicated integrals (see [Dobrokhotov et al., 1991]). Our
experience show that it is much easier to find explicit
formulas applying the ideas mentioned above directly to the
problem (1, 2). We present now the final
formulas.
 | (20) |
 | (21) |
[24] The projections
x=X(y, t) of the trajectories on the plane
 are called the "rays". Recall that the "front" in the
plane
  at the time
t>0 is the curve
gt ={x
 2|x=X(t,y),
y
 [0,2p)}, (see e.g.
[Arnold, 2001; Maslov, 1965]). The points on this
curve are parameterized by the angle
y
 [0,2p).
If
 X/
X/ y
y 0 in each point
x of the wave front
gt, then the wave front is a smooth curve. The points where
 X/
X/ y=0 are named "focal points". In these
points the wave front looses its smoothness. In the situation in which the
focal points appear, (they are very interesting from the point of view of
tsunami), it is reasonable to introduce the concept of wave front in the phase
space
  4p,x
at the moment
t>0, i.e. the curve
Gt={p=P(t,y), x=X(t,y), y
 [0,2p]}. We note that at
least one of the component of the vector
Py, Xy is different from
zero and also the rays
x=X(t,y) are orthogonal to the wave front
gt:
 X,Xy
X,Xy =0.
=0.
 [d, t1]. The first instant of
time
t1 at which focal points are formed is called "critical" and
denoted
tcr. First, we assume that
d
 y,X<font face="Symbol">y(t,y)
 =0.
=0.
[26] The phase is defined by
 | (22) |
[27] Now we state the first main proposition of this paper.
Proposition 1. For
tcr > t > d > 0, in some neighborhood of the wave front
gt, not depending on
m,
h , the asymptotic elevation of the free surface, has the form:
|
[28] In order to compute the elevation
h(x,t) at the point
x and time
t, one has to find the trajectory of the Hamiltonian
system starting from
x=0 and arriving at time
t in the point
x. Then it is possible to compute the phase
S(x,t) using the
approximation written above. The trajectory is defined (see
(20)) by the function
H(x) and the angle
y(x,t) which is the angle between the
x1 axis and the ray arriving
at the point
x at the instant
t from the origin
x=0, where
the ray was at the instant
t=0. So
y can be find by the
solution of equation
x=X(t,y). The solution exists and it
is unique since the vector
 X/
X/ y
y 0 before the critical time.
[29] Explicit formula (23) shows that the elevation of the free surface h(x,t) is defined by the form of the initial disturbance through the function F(z,y) and by the variation of the depth of the basin along the trajectories of the system.
[30] It should be noted that despite of the simple and natural form of (23) its proof is not trivial at all. The main step is to prove the fact that the formula is the same as in the case of constant bottom, if the wave rays are found correctly.
[31] Now we derive some consequences from formula (23). Since the phase S(x,t) is equal to zero on the wave front and |S(x,t)|/l increases rapidly going out from it, then maximum of |h| is attained in a neighborhood of the wave front. Moreover, h(x,t) can exhibit few oscillations depending on the properties of the function F(z,y) (which in turn, depend on the form of the initial disturbance, see Figures 1 and 2). The second factor in (23) can be interpreted as two dimensional analogue of the Green law, well known in the theory of tidal waves in the channels: amplitude of h increases as 1/(H(x))1/4 when the depth H(x) of the basin decreases; the factor 1/(|Xy|)1/2 is connected to the divergence of the rays, in other words if a smaller number of rays goes through a neighborhood of the point X(t,y), the smaller will be the amplitude of the wave field. The factor (H(0) / (H(X(t,y))) in the phase S(x,t) (see (22)) expresses the phenomena known as the "contraction'' of the wave profile and explains the fact that the wave length of a tsunami decreases when the wave approaches the coast.
[32] We can imagine the following situation. Let two rays start from x= 0 with two very different angles y1 and y2, arrive to the wave front in two nearby points due to properties of the function H(x). Let also assume that the values of the function F(z,y) are very different for the angles y1, y2 and equal values of z (due to the form of the initial disturbance). Then the amplitudes of h(x,t) can be very different at these nearby points.

|
| Figure 3 |

|
| Figure 4 |

|
| Figure 5 |
[35] The Maslov index takes one of the following integer values: 0,1,2,3. It is defined in many ways and containing the topological information of the problem under considerations. We have shown in the paper [Dobrokhotov et al., 2006b] that for the problem (1, 2) one can simplify its calculation connecting mj=m(yj(x,t),t) with the Morse index which counts the number of focal point staying on a trajectory. So this is the Proposition generalizing the formula from Proposition 1:
|
Proposition 2. In a neighborhood of the front but outside of some neighborhood of the focal points the
wave field is the sum of the fields
Outside this neighborhood of the front gt h(x,t)= O(m3/2). Again the function F(z,y) is defined in (13). |

|
| Figure 6 |
[37] Let us emphasize that the number m has a pure topological and geometrical character and can be calculated without any relation with the asymptotic formulas for the wave field. From the Proposition 1, 2 it follows that, in order to construct the wave field at some time t in a point x, one has to know only the initial values h|t=0 and ht|t=0 and has not to know the wave field h for all previous time between 0 and t. The trajectories and the Maslov (Morse) index take into account all metamorphosis of the wave field during the evolution from zero time until time t. In the paper [Dobrokhotov et al., 2006b] some theorems have been shown for connecting those two indices and in the computer program which implements this algorithm there is a simple way for finding the focal points studying the change of the sign of the jacobian of the map. Note also that these formulas are easy to invert for finding the parameters of the shift V from the measures of the wave heights done at some stations.
 can include
several arcs of
gt with the angles
y different from
yF(t). This means that one has to take into account the
contribution of all of these arcs in the final formulas for
h in the neighborhood of the point
x=X(t,yF(t)). The
influence of nonsingular points are defined by formula
(25) and the influence of the points from the
neighborhood of the focal points are described by formulas
(31) given below. Thus it is necessary to enumerate
the focal points with nearby projections and write
P(t,yFj(t)),X(t,yFj(t)). These points have the same
position
XF=X(t,yFj(t)), but different momentum
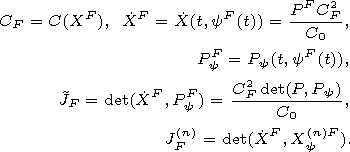
PF=P(t,yFj(t)). To simplify the notation we discuss here
the influence on
h of only one focal point omitting the
subindex
j but keeping
PF.
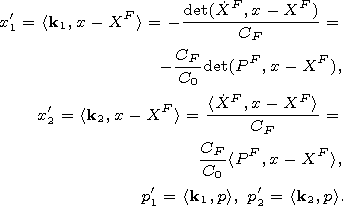
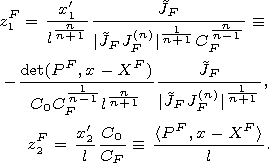
[40] We present the corresponding formula under the assumption that some derivative
 | (25) |
and the derivatives
X(k)F<font face="Symbol">y=0 for
1 < k

(26)
and some characteristic quantities of the focal point (PF,XF):
 | (27) |
[41] Again the topological characteristic appears, i.e. the Maslov index of this
focal point or its neighborhood (it is the same), but now it depends on the
choice of the coordinates in the neighborhood of
(PF,XF). It is natural to
choose the new coordinates
(x'1,x'2) associated with the nonzero vector
XF= X(t,yF(t)); namely we assume that the direction of the new
vertical axis
x'2 coincides with the vector
XF. We put
k2=(k21,k22)T= XF/| XF| =
XF/CF=PF CF/C0,
k1=(k11,k12)T=(k22,-k21)T and introduce the new coordinates
p',x' in the neighborhood of
(PF,XF) in
the phase space
 4p,x
by the formulas:
 |
[42] It is easy to see that
 | (28) |
 F
F 0
in the focal point
(PF,XF),
hence the same inequality takes place in some of its neighborhood,
thus
  has a constant sign. On the contrary the Jacobian
J changes sign in this neighborhood. We define the Maslov index
m(PF,XF) of the non (completely) degenerate focal
point
(PF,XF)=(P,X)(t,yF(t)) as the index
 of a regular point
  in the neighborhood of
(PF,XF) such that the signs of the determinants
 and
and  coincide. For instance one can
choose
  =yF(t),
 =t
=t d,
where
d is small enough. This means that we compare the sign of
J with the sign of
  on the trajectory
(P,X) crossing
the curve
Gt in the focal point
(PF,XF) before and
after this crossing.
 and introduce the function
(or more precisely the linear operator acting on the source
function
V(y1,y2) )
 |
We put
 |
|
Proposition 3. In a neighborhood of the front
gt each focal point
(PF,XF) gives the following contribution to the asymptotic values of the solution
h
If several arcs of gt belong to the neighborhood of the point x, then one needs to sum over all the corresponding functions (32) and (25). |

Powered by TeXWeb (Win32, v.2.0).