 and
M
and
M , respectively,
the
system of equations 6(a-d) can be written as follows
[Gershenzon et al., 1993]:
Comparison of the strengths of the various types of sources using scaling arguments as in Section 3 gives us some superficial information about relative strengths. More accurate results would require solving the system of equations 6(a-d), 7(a-c), and the appropriate equation connecting the magnetization or polarization to the mechanical state of the crust (cf. equations 9-14). In general such solutions cannot be obtained analytically without some simplification.
The goal of this section is to present a set of asymptotic formulas for estimating the magnitude of the electric and magnetic fields at the earth's surface over a broad frequency range, ranging from quasi-static to radio frequencies, generated by mechanical disturbances in the earth's crust. We will also present the results of calculations of the spectral density of an EM source produced by an impulse mechanical source due to various mechano-electromagnetic coupling mechanisms.
First we consider the electromagnetic fields to be weak enough that they do not influence
the
mechanical state, i.e. the stress and strain tensors are independent of
E and
H.
We also assume that the size of the source is much smaller than the distance
from the source to the field point (dipole approximation).
We are ignoring higher-order multipoles; their effect is normally negligible unless
the
dipole moments vanish. Introducing a distribution of effective electric and magnetic
dipoles characterized by
P and
M
and
M , respectively,
the
system of equations 6(a-d) can be written as follows
[Gershenzon et al., 1993]:
 | (16a) |
 | (16b) |
 | (16c) |
 | (16d) |
where
 | (17a) |
 | (17b) |
and the bar symbol indicates an integration over volume, i.e.,
J0
 J0 dV,
etc. We also have
 | (17c) |
and
 | (17d) |
As expressed in equation 17d, we can always consider J0 as the sum of two contributions, a rotational part J0 rot associated with magnetic dipoles and an irrotational part J0 irrot associated with electric dipoles.

|
| Figure 2 |

|
| Figure 3 |
 r
r rB in the near zone,
rB
 r
r rC in the intermediate zone
and
r
 rC in the far
zone. The distances
rA, rB, and
rC are
defined by
We shall estimate the value of these distances for typical values of
s, e and
m.
In this paper we shall take
e=3e0
and
m=m0
for
the crust, where
e0 and
m0 are the values in vacuum.
Most frequencies
f=w/2p
of interest lie in the range
10-3 Hz
The expressions for the fields close to the surface for
monochromatic electric and magnetic dipoles
[Banos, 1966]
are given in Appendix B. At the interface, all these expressions will contain
the complex exponential factor
eik1h, which
includes the attenuating
effect of the crust. Introducing the parameter
the exponential can be written,
For
w
For distances
r>rA, the formulas of Banos [1966]
could be used.
However, as we have seen, in the quasi-static range and part of the ULF range,
these formulas do not apply because
rA exceeds the range of interest. Even
at higher frequencies, when
rA becomes small, we need a formula for
r
For a static magnetic dipole, we have
E=0 and
where
R is the distance from the source.
For a static electric dipole embedded in a conducting half-space, we use
if the dipole is oriented horizontally along the
x axis, and
if the dipole is vertical. These formulas were obtained in the point dipole
limit of expressions given by Edwards [1975] and
Gokhberg et al. [1985].
Now consider the case
w>s/e,
for which the Banos
formulas do not apply. For this case we can ignore the conductivity of the
crust (as long as the source depth is less than the skin depth) and use formulas
appropriate to a dipole in vacuum. For distance
r less than
rB (i.e. less
than the vacuum wavelength/
2p ), the following formulas
[Landau and Lifshitz, 1971]:
for an electric dipole, and
for a magnetic dipole.
For distances
r greater than
rB, we have [Landau and Lifshitz, 1971]
for an electric dipole, and
for a magnetic dipole.
Once we have a solution for the monochromatic source the standard procedure for solving
the
time-dependent problem is to integrate the monochromatic solution over all frequencies,
weighted by the
spectral density of the source. In order to estimate the parameters of the EM emission
it is useful to consider
an impulse dipole source, since the mechanical disturbances have an impulse structure
(see Section 2).
Using equations 17(a-d), 10-14, 1, 1(a-b) and 3, we can express the electric
and magnetic dipoles for all
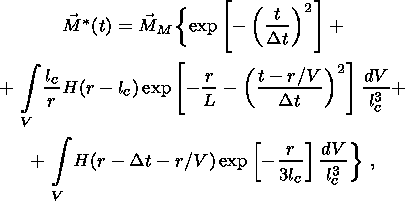
the source types considered here. For a piezomagnetic source, the magnetic dipole
has the following form:
where
and the integral is over the volume
V crack = lc3 associated with
a crack.
The magnetic and electric dipoles for an induction source have essentially the
same form as equation 21a, except that the third term is absent and
MI and
PI appear in place of
MM. The electric dipole
for an electrokinetic source has the form shown in equation 21b:
where
The electrokinetic source appears as a discontinuity in the electrokinetic properties
of the
medium across a planar boundary, so the last two terms in equation 21b are expressed
as
surface integrals rather than volume integrals. See Appendix C for a more detailed
explanation.
For a piezoelectric source, the electric dipole can be expressed as
where
and
n(r) is a unit vector in the direction of the local
dipole moment
in the volume element
dV at point
r in the crust. This local moment
has magnitude
| PE| attenuated by the factor
(lc/r)e-r/L.
The magnitudes of
MM, MI, PI,
PK and
PE will be determined later in
this section.
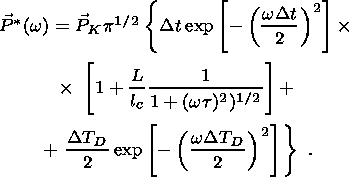
Now we can find the associated spectral densities. For a piezomagnetic source we
have,
where
t=L/V is the lifetime of the seismic
impulse. The same expression (without the last term) also gives
the spectral density for the magnetic and electric dipoles of an induction source.
Using equation 21b we can find the spectral density associated with an electrokinetic
source. We
obtain
Figures 4b
and 4c
show
P
Finally, we consider the spectral density associated with a piezoelectric source.
The orientation
of piezoelectric grains are usually random, but in some cases may be partially ordered.
We need to consider
both cases. First, suppose there is a preferred orientation
n= PE/PE.
Using equation 21c we find
Figure 4d
shows this spectral density. As before, curve 1 is for the crack only. The presence
of the seismic
impulse (curves 2-4) increases the magnitude of the maximum and shifts it to lower
frequencies.
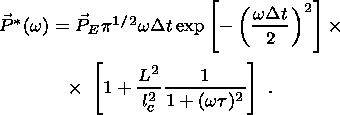
For the case of random orientation we have
In obtaining this result we assumed that the contribution from grains located at
distance
r from the crack is proportional to
[N(r)]1/2, where
N(r) is the number
of such grains, given by approximately by
4pr2/lc2.
Figure 4e
shows that
including the seismic impulse increases the low frequency part of the spectrum.
Comparison of the spectra of the various sources considered here (Figures 4(a-e))
shows that piezomagnetic and electrokinetic sources activate the low-frequency
EM modes while a piezoelectric source activates the
high-frequency modes. Note that in most cases the contribution of an acoustic impulse
generated by a crack
is much larger then the contribution of the crack itself.
Even for these simplified spectral densities, however, an exact solution for the
radiation fields
would require a more accurate solution to the monochromatic problem, over all frequencies,
than is afforded
by using the asymptotic formulas. Attempting such a solution would lie outside the
scope of this paper.
Nevertheless, based on our results so far, we can arrive at some qualitative conclusions
concerning the shape
and behavior of an electromagnetic pulse propagating along the earth's surface.
For
w max
For
w max>wh,
which is the usual case, attenuation will be small
in the frequency range
0<w<wh
but will be significant in the range
w>wh.
The shape of the radiation pulse will be altered by
this dispersion. With increasing distance from the hypocenter, the pulse will broaden
and become oscillatory
in addition to becoming weaker.
where
q and
e are the volume and shear strains, respectively.
For either type of strain, the spatial
dependence can be considered to be some linear combination of a unipolar and a bipolar
square pulse
(Figure 5).
Thus for a shear strain,
where
e up and
e bp are the magnitude of the unipolar
and bipolar shear strains
respectively. A similar expression can be written for the volume strain
q.
Based on the expressions for
e(w, r)
and
q(w, r)
and
on the formulas of this section and the previous section (equations 21(a
From this table we see that a piezomagnetic source produces a magnetic dipole for
a unipolar
pulse, while a piezoelectric source produces an electric dipole for a unipolar pulse.
An electrokinetic
source produces an electric dipole for a unipolar pulse volume strain. An induction
source produces a
magnetic dipole for a bipolar pulse and an electric dipole for a unipolar pulse.
Now we have all the formulas necessary to estimate the electromagnetic
field at the earth's surface
due to a mechanical disturbance in the earth's crust. The relevant equations and
the various cases to which
they apply are summarized in Table 3.
So far in this section we have considered the temporal and spatial distribution of
the
electromagnetic field from an impulse source. To compare with measurements we must
consider how the
real EM field at the detector is related to what the detector records. The latter
depends on the measurement
technique and the detector parameters.
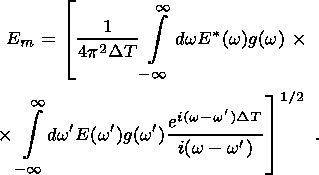
Usually any detector of electromagnetic emissions will have two distinct parameters,
the
frequency channel and the acquisition time. We characterize the frequency channel
by a filtering function
g(w) and denote the acquisition time by
DT. If we denote by
Em the
mean electric field recorded by the detector, and by
Ef (t) the filtered electric
field at the detector at time
t ( 0
and
where
E(w) is the fourier component (i.e. spectral
density) at frequency
w of the source electric field at the location
of the detector. Using equations 23
and 24 and doing the integration over
t, we can express
Em as
For simplicity we take
i.e. a frequency window of width
Df = Dw/2p centered
at frequency
f0 = w0/2p.
We suppose that
Df
We will assume the duration
Dt of the impulse to be small enough that
(Dt)-1
Let's consider two quite different cases. In the first case,
(DT)-1
while in the second case we get
Suppose that during the time
DT
The preceding discussion can be carried through for the magnetic field, with completely
analogous
results. The first case results in
and the second case in
We thus obtain two different formulas for the measured field
Em (or
Bm ).
If
Df = Dw/2p = 103 Hz
and
DT = 10 s, the relative
magnitudes of
Em (or
Bm ) from the two expressions (26) and (27) (or (28)
and (29))
is
(DfDT)1/2=100.
The reason for this difference requires some
clarification. In equations (26) (or (28)), the detector accumulate the energy
throughout the time
DT. If the source is emitting in an impulse
mode,
with a pulse width
Dt
For both
Em and
Bm, we will see later in Section 5 that the two cases
imply two different
measurement techniques, and the probability of detecting an observable SEM anomaly
may depend critically
on which technique is used.
This document was generated by TeXWeb
(Win32, v.1.3) on October 28, 2000.
 s
s 10-1/W-m.
Figure 3
shows the dependence of
rA, rB and
rC on frequency for three
different values of
s. We are interested in distance less than 1000 km.
From the figure we see that the Banos formulas cannot be used in the quasi-static
regime ( f<10-2 Hz) except for large conductivities
( s>10-1/W-m.)
and for distances
r>10 km, since
r must be greater than
rA and here
rA=10 km for
s=10-1/W-m
and
f=10-2 Hz. In the ultra-low
frequency (ULF) range ( 10-2 Hz
 rB
rB rC, the displacement
current in the crust approaches the conductive current, and the Banos formulas
no longer apply.

 e-(w/wh)1/2.
 wh
the attenuation will make the fields negligible at the
interface. For
w
 wh
there is no appreciable attenuation and
the radiation propagates along the surface away from the hypocenter as an
inverse power of the distance.
B. Asymptotic Formulas for
r > |(w2me + iwms)-1|
 h. In this zero-frequency
approximation, any electric field produced by the magnetic dipole is ignored.

(18a) 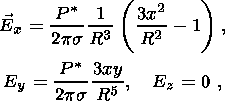
(18b) 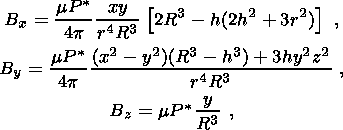
(18c) 
(18d) C. Asymptotic Formulas for w > s/e

(19a) 
(19b) 
(19c) 
(19d) 
(20a) 
(20b) 
(20c) 
(20d) D. Spectral Density of Electric and Magnetic Dipoles
(21a) 
(21a') 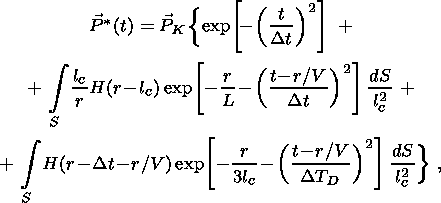
(21b) 
(21b') 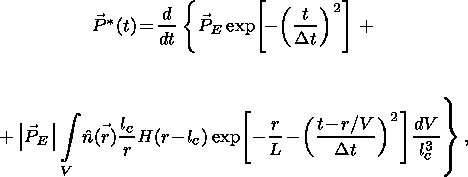
(21c) 
(21c') 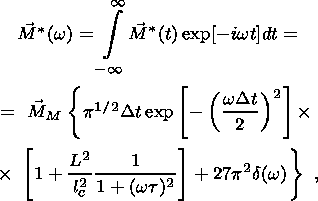
(22a)
Figure 4a shows
M

Figure 4
 (w)
for various value of
L. Curve 1 ( L=lc=1 mm)
is the contribution of only the microcrack and corresponds to the first term in equation 22a.
It consists of a zero-frequency spike (not shown in the figure because of the
logarithmic scale) and a broad, flat spectrum extending from zero up to
wc=(Dt)-1,
with magnitude
MMp1/2Dt. The
contribution of the impulse (curves 2-4) increases the spectral
density magnitude by the factor
(L/lc)2 and shifts the spectrum to a
lower
frequency range
(0<w<w imp
 t-1).
t-1).
(22b)  (w)
for several values of
L, including
the cases
L=lc=0.1 m (Figure 4b) and
L=lc=10 m (Figure 4c). In both
cases, curve 0 represents the contribution of the crack itself and
corresponds to the first term in equation 22b. Including
the diffusion of
pore water (third term) results in curve 1. Including the contribution of the
impulse (second term) results in curves 2-4. The impulse contribution
scales as ( L/lc ). From these figures we see that the contribution
of the
diffusion and impulse terms exceeds that of the crack itself at low frequencies.
For a small crack (Figure 4b) the impulse contribution exceeds the
diffusion contribution, but for a large crack (Figure 4c) the diffusion term
dominates.
(22c) 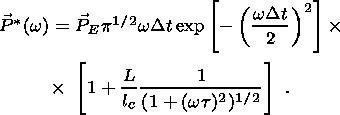
(22d)  wh, attenuation is very
small, as noted above.
In particular, the shape of the radiation pulse observed at the surface will be
similar to that of the dipole pulse and, therefore, of the mechanical
pulse producing it. Its intensity will fall off as some inverse power of the distance
from the hypocenter.
E. Magnitude of Magnetic and Electric Dipole Moments
Now let us determine the electric and/or magnetic dipole associated with various
mechanical
sources. To do this we need to assume that the strain tensor is a given function
of space and time. This
tensor can always be represented as the sum of a pure volume strain (diagonal components
only) and a pure
shear strain (off-diagonal components only). For example, in an isotropic medium,

Figure 5

 [H(y
+ lc/2) -
  [H(z
+ lc/2) - H(z - lc/2)],
 ,
b
,
b ,c
,c ), 17(a-d), 10-14
and A9), the magnetic and electric
dipoles for various sources, after integrating over the spatial coordinates, are
presented in Table 2 in terms of the parameters of the mechanical disturbance.
F. Relation Between Measured and Actual Fields at the Detector

(23) 
(24) 
(25) 

 f0.
This is the usual case experimentally.
 w0; thus we expect the spectral
density
E(w) to be a slowly varying function of
w in the neighborhood of
w0.
This will be used in integrating equation 25.
 Dw
Dw w0,
while in the second case
Dw
 (DT)-1<w0. In the first
case, integration of equation 25 yields

(26a) 
(27a)  Dt there are
N electric impulses
randomly distributed in time which appear at the measurement point. Then it is easy
to show that the average field from
N equal impulses scales as
N1/2, as a
consequence of their random nature. In this case equations 26a and 27a yield

(26) 
(27) 
(28) 
(29)  DT, there is a considerable amount of
"dead time'', during which the detector receives no signal. This reduces the
average signal considerably. In equations (27) and (29) we suppose that
Dw
 (DT)-1<w0, which means that the detector is receiving
a signal
throughout its acquisition time. This is why
DT does not appear in equations 27
and 29 and a much lager signal is measured (for an impulse source).