RUSSIAN JOURNAL OF EARTH SCIENCES, VOL. 21, ES3003, doi:10.2205/2021ES000769, 2021
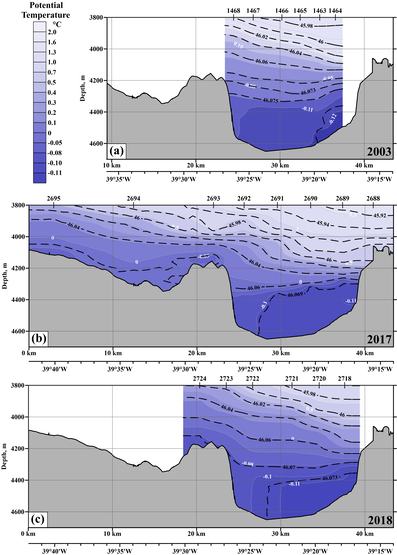
Figure 1. Distributions of potential temperature (° C) over the zonal sections across the channel at the Vema Sill (31° 12$'$–31° 14$'$ S) in 2003 (a), 2017 (b), and 2018 (c). Contour lines of density are shown with thick dash-dotted lines.

![]()
Citation: Morozov E. G., D. I. Frey, V. A. Krechik, M. V. Kapustina, M. N. Pisareva (2021), Structure of the bottom water flow in the Vema Channel based on the measurements from the R/V
Copyright 2021 by the Geophysical Center RAS.
Generated from LaTeX source by ELXfinal, v.2.0 software package.