RUSSIAN JOURNAL OF EARTH SCIENCES, VOL. 20, ES6008, doi:10.2205/2020ES000724, 2020
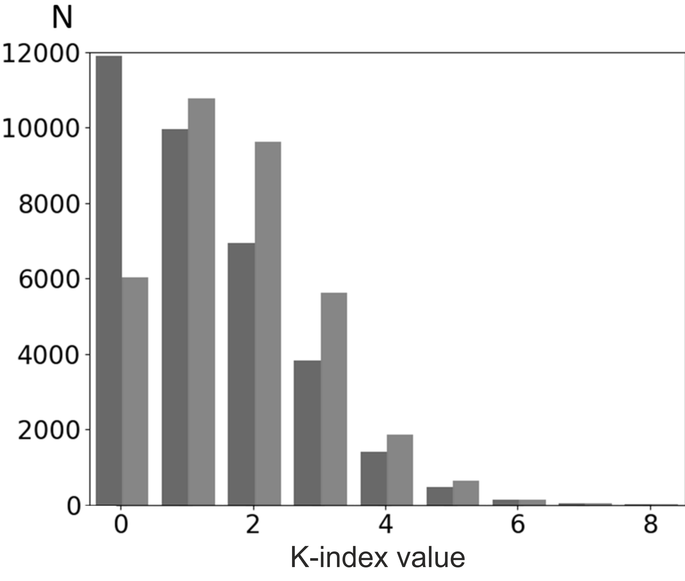
Figure 5. Histogram of the distribution of occurrence of different values of the planetary $Kp$-index (black) and $K$-index for the Borok observatory calculated with the limit $K9=700$ nT (grey) for 2005–2016.

![]()
Citation: Petrov Valery G., Roman I. Krasnoperov (2020), The aspects of
Copyright 2020 by the Geophysical Center RAS.
Generated from LaTeX source by ELXfinal, v.2.0 software package.