RUSSIAN JOURNAL OF EARTH SCIENCES, VOL. 20, ES5005, doi:10.2205/2020ES000715, 2020
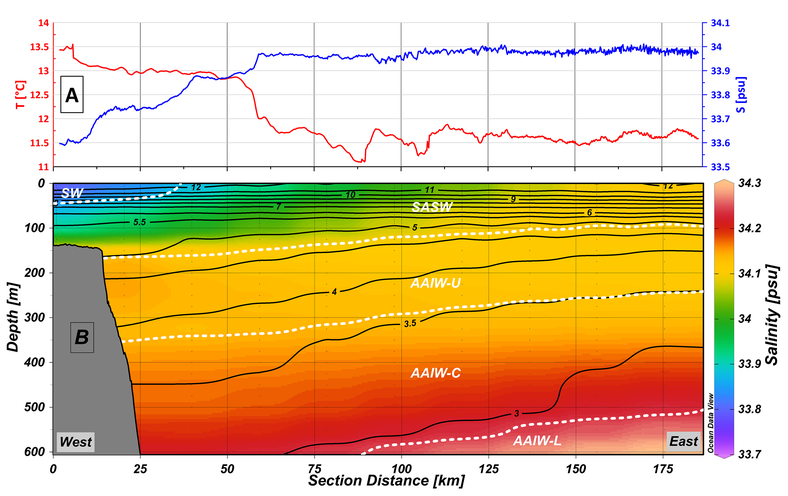
Figure 2. Distribution of potential temperature and salinity over the section across the Malvinas/Falkland current. A: Spatial distribution of temperature (red solid line) and salinity (blue solid line) in the surface layer along the section based on the SBE 21 thermosalinograph data. B: Potential temperature isotherms (solid black lines) over vertical salinity distribution field (color) in upper 600-m layer of the study region in January. The white dashed lines mark the borders of water masses according to its isopycnal limits. The data are based on WOA 13.

![]()
Citation: Krechik V. A. (2020), The upper layer of the Malvinas/Falkland current: Structure, and transport near 46\deg S in January 2020, Russ. J. Earth Sci., 20, ES5005, doi:10.2205/2020ES000715.
Copyright 2020 by the Geophysical Center RAS.
Generated from LaTeX source by ELXfinal, v.2.0 software package.